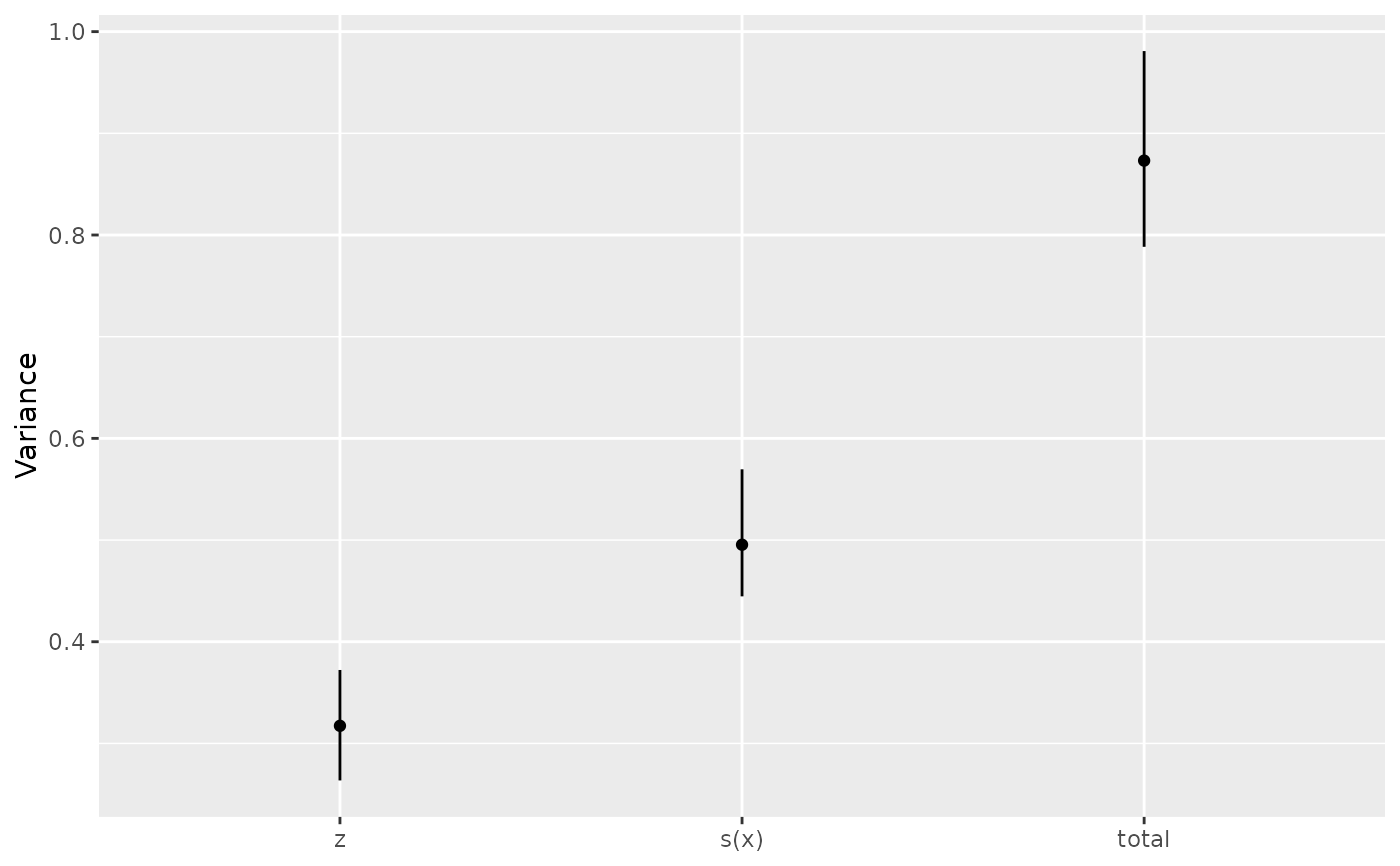
Plot variance components and proportions of term variance
Source:R/draw-variance-components.R
draw.variance_comp.RdDraw estimates and their stored confidence intervals, with components on the x-axis by default. No model fitting or posterior sampling is performed.
Arguments
- object
A result from
variance_comp().- type
What to plot:
"variance"(the default),"std_dev", or"proportion". Proportions requirevariance_comp(..., type = "terms").- select
Components to plot, as exact names, positive integer positions, or a logical vector with one entry per row of
object. Components are displayed from left to right in the requested order, or from top to bottom withflip = TRUE. Use positions when component names are duplicated.- include_total
Logical; include the total rows of term results? Defaults to
TRUE. Selection positions refer toobjectbefore totals are removed.- predictor
Linear predictors to plot for
type = "proportion", as positive integer positions or total labels ("total","total.1", and so on). The default plots all predictors, with separate panels when more than one is present. Shared terms appear in each relevant panel.- ncol, nrow
Number of columns or rows for the panels.
- angle
Numeric; angle of the component labels in degrees, between -90 and 90. Passed to
ggplot2::guide_axis(). The default,NULL, uses the angle specified by the plot theme.- n_dodge
Positive integer; number of rows for component labels, or columns with
flip = TRUE. Use, for example,n_dodge = 2to stagger labels that would overlap. Passed to then.dodgeargument ofggplot2::guide_axis(). Defaults to 1.- flip
Logical; put components on the y-axis? Defaults to
FALSE.- ...
Not used. Modify the returned plot with ggplot2 layers, scales and themes.
Value
A ggplot2::ggplot() object.
Details
Variance plots square the stored standard-deviation interval bounds so that estimates and intervals use the same scale. Standard-deviation and proportion plots use their stored bounds directly. Components with unavailable intervals retain their points. Intervals are drawn when both bounds are finite. Undefined estimates have no point, but retain their component labels.
Proportions can be negative or greater than one, and the plot preserves those values. Each panel shows only terms belonging to that predictor and its own total. A predictor with zero total variance has undefined proportions and is displayed without points or intervals.
Points use the geom.gratia.effect theme element and intervals use
geom.gratia.interval; see gratia_theme_get().
Label layout
Pass label_control = draw_label_control(...) to draw() to wrap discrete
axis labels and legend text, stagger discrete tick labels, or adjust legend
and colour-bar layout. Settings apply to each panel, including unwrapped
plot lists. See draw_label_control() for the available settings.
Examples
load_mgcv()
# Simulate linear and nonlinear effects with Gaussian noise
set.seed(42)
dat <- data.frame(x = runif(120), z = runif(120))
dat$y <- 2 * dat$z + sin(2 * pi * dat$x) + rnorm(120, sd = 0.3)
# Fit a linear effect of z and a smooth effect of x
model <- gam(y ~ z + s(x, k = 8), data = dat, method = "REML")
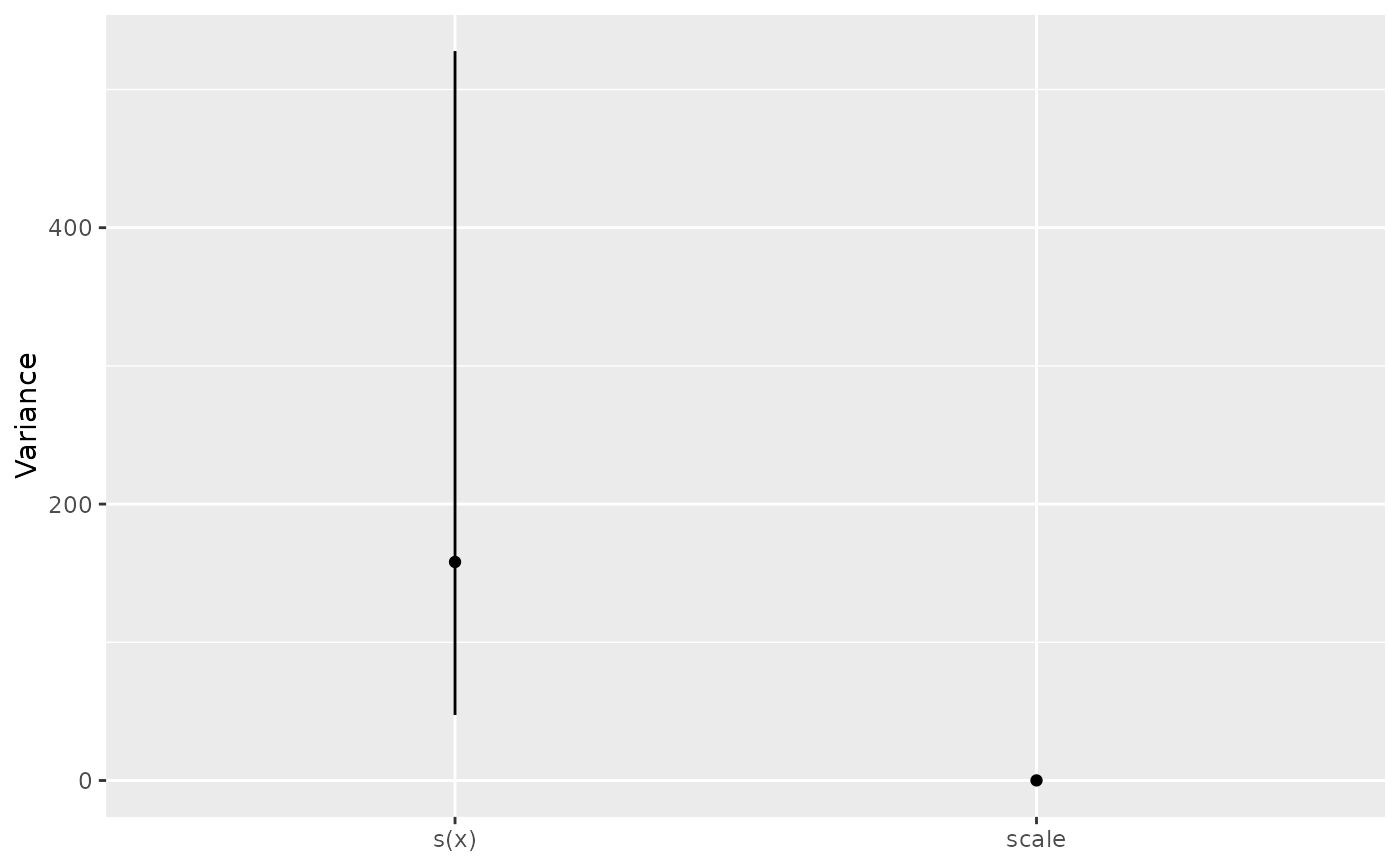
# Plot the variances used in the random-effect representation of the penalties
components <- variance_comp(model)
draw(components)
 # Plot variation of fitted term contributions across the fitting observations
terms <- variance_comp(model, type = "terms", n_draws = 200, seed = 42)
draw(terms)