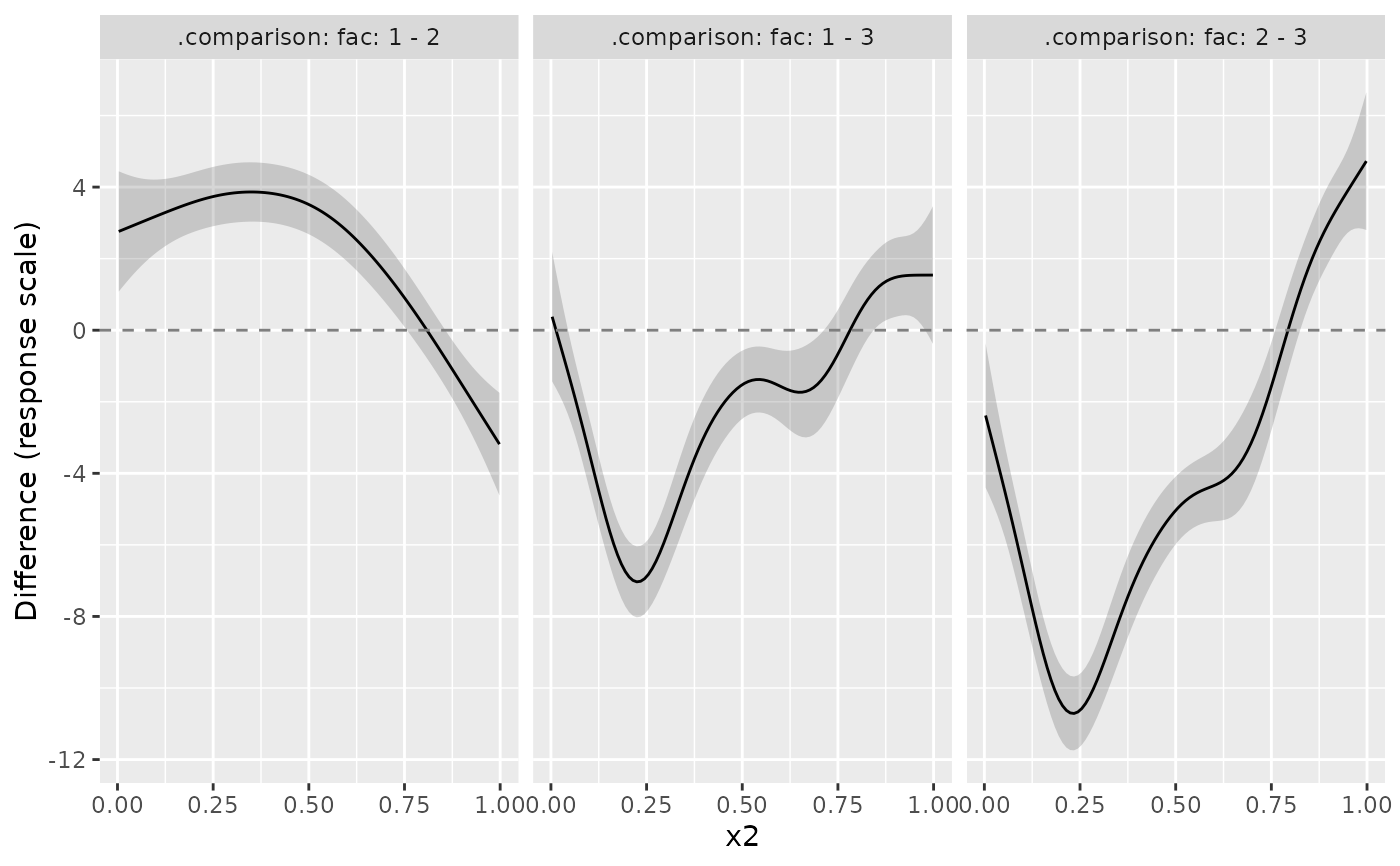
Display conditional differences with pointwise or simultaneous intervals and a
zero reference line. Each comparison is shown in a separate facet; additional
conditioning variables use colour and facets as in draw.conditional_values().
Usage
# S3 method for class 'conditional_differences'
draw(
  object,
  facet_scales = "fixed",
  discrete_colour = NULL,
  discrete_fill = NULL,
  xlab = NULL,
  ylab = NULL,
  ...
)
Arguments
- object
an object returned by
conditional_differences().- facet_scales
character; should facets have the same axis scales across facets? See
ggplot2::facet_wrap()for details. Options are:"fixed"(default),"free_x","free_y", and"free".- discrete_colour
a suitable colour scale to be used when plotting discrete variables.
- discrete_fill
a suitable fill scale to be used when plotting discrete variables.
- xlab
character; label for the x axis of the plot.
- ylab
character; label for the y axis of the plot.
- ...
arguments passed to
draw.conditional_values().