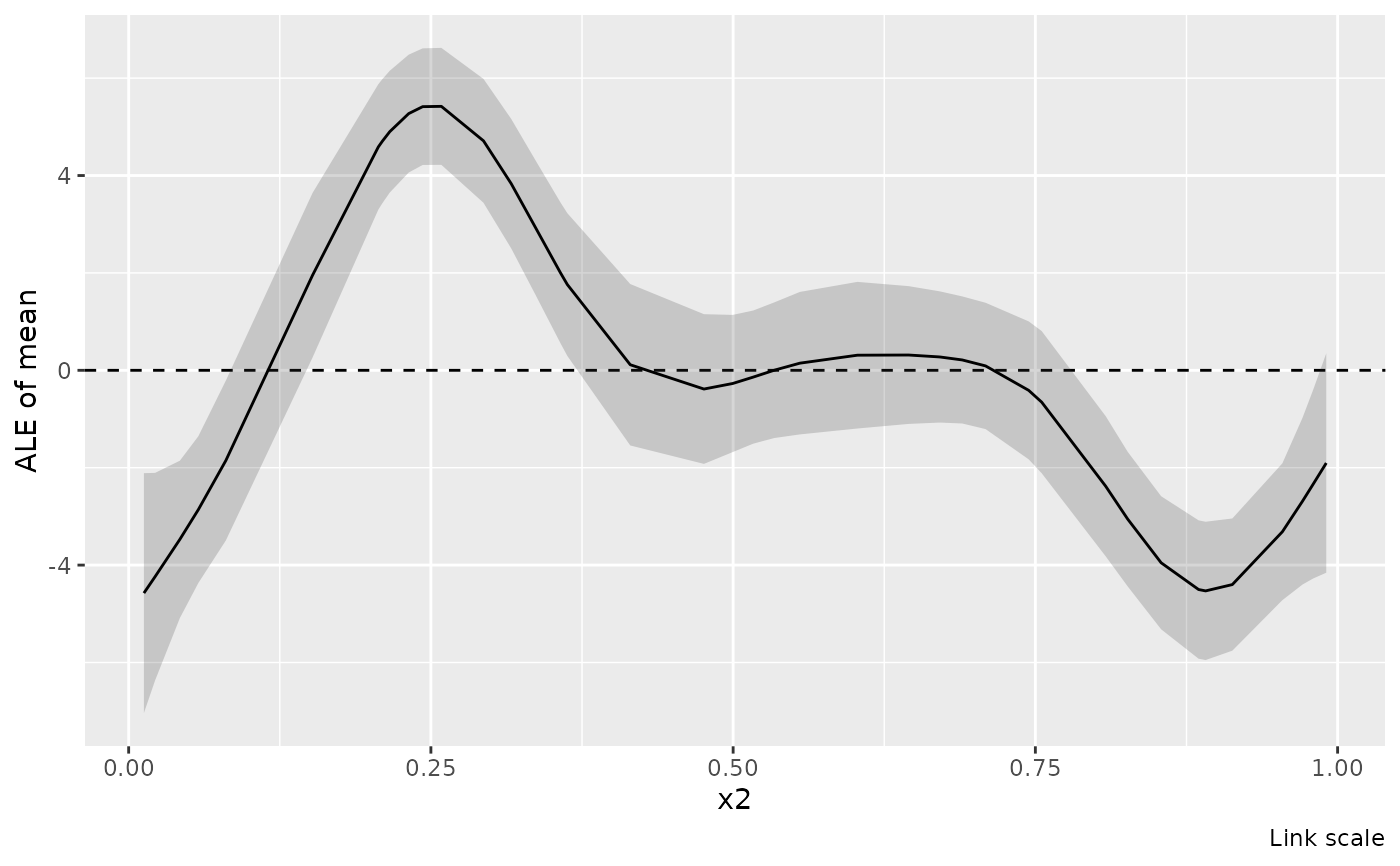
Plot saved ALE estimates and intervals, without recomputing predictions.
Usage
# S3 method for class 'ale'
draw(
  object,
  ci = TRUE,
  ref_line = TRUE,
  alpha = 0.2,
  xlab = NULL,
  ylab = NULL,
  ...
)
Arguments
- object
a tibble of class
"ale", produced byale().- ci
logical; show the saved interval ribbon?
- ref_line
logical; draw a horizontal reference line at zero?
- alpha
Deprecated; use
gratia_theme_get()theme settings instead. Numeric; opacity of the interval ribbon.- xlab, ylab
optional axis labels. Defaults identify the focal covariate and selected parameter. The computation scale appears in the caption. Titles and subtitles are omitted. Use
ggplot2::labs()to change or remove the caption, for example+ ggplot2::labs(caption = NULL).- ...
reserved for future use.
Value
A ggplot2::ggplot() object.
Label layout
Pass label_control = draw_label_control(...) to draw() to wrap discrete
axis labels and legend text, stagger discrete tick labels, or adjust legend
and colour-bar layout. Settings apply to each panel, including unwrapped
plot lists. See draw_label_control() for the available settings.