Plot differences of smooths
Usage
# S3 method for class 'difference_smooth'
draw(
  object,
  select = NULL,
  rug = FALSE,
  ref_line = FALSE,
  contour = FALSE,
  contour_col = "black",
  n_contour = NULL,
  ci_alpha = 0.2,
  ci_col = "black",
  smooth_col = "black",
  line_col = "red",
  scales = c("free", "fixed"),
  ncol = NULL,
  nrow = NULL,
  guides = "keep",
  xlab = NULL,
  ylab = NULL,
  title = NULL,
  subtitle = NULL,
  caption = NULL,
  angle = NULL,
  ...
)
Arguments
- object
a fitted GAM, the result of a call to
mgcv::gam().- select
character, logical, or numeric; which smooths to plot. If
NULL, the default, then all model smooths are drawn. Numericselectindexes the smooths in the order they are specified in the formula and stored inobject. Characterselectmatches the labels for smooths as shown for example in the output fromsummary(object). Logicalselectoperates as per numericselectin the order that smooths are stored.- rug
logical;
- ref_line
logical;
- contour
logical; should contour lines be added to smooth surfaces?
- contour_col
colour specification for contour lines.
- n_contour
numeric; the number of contour bins. Will result in
n_contour - 1contour lines being drawn. Seeggplot2::geom_contour().- ci_alpha
numeric; alpha transparency for confidence or simultaneous interval.
- ci_col
colour specification for the confidence/credible intervals band. Affects the fill of the interval.
- smooth_col
colour specification for the the smooth or difference line.
- line_col
colour specification for drawing reference lines
- scales
character; should all univariate smooths be plotted with the same y-axis scale? If
scales = "free", the default, each univariate smooth has its own y-axis scale. Ifscales = "fixed", a common y axis scale is used for all univariate smooths.Currently does not affect the y-axis scale of plots of the parametric terms.
- ncol, nrow
numeric; the numbers of rows and columns over which to spread the plots
- guides
character; one of
"keep"(the default),"collect", or"auto". Passed topatchwork::plot_layout()- xlab, ylab, title, subtitle, caption
character; labels with which to annotate plots
- angle
numeric; the angle at which the x axis tick labels are to be drawn passed to the
angleargument ofggplot2::guide_axis().- ...
additional arguments passed to
patchwork::wrap_plots().
Examples
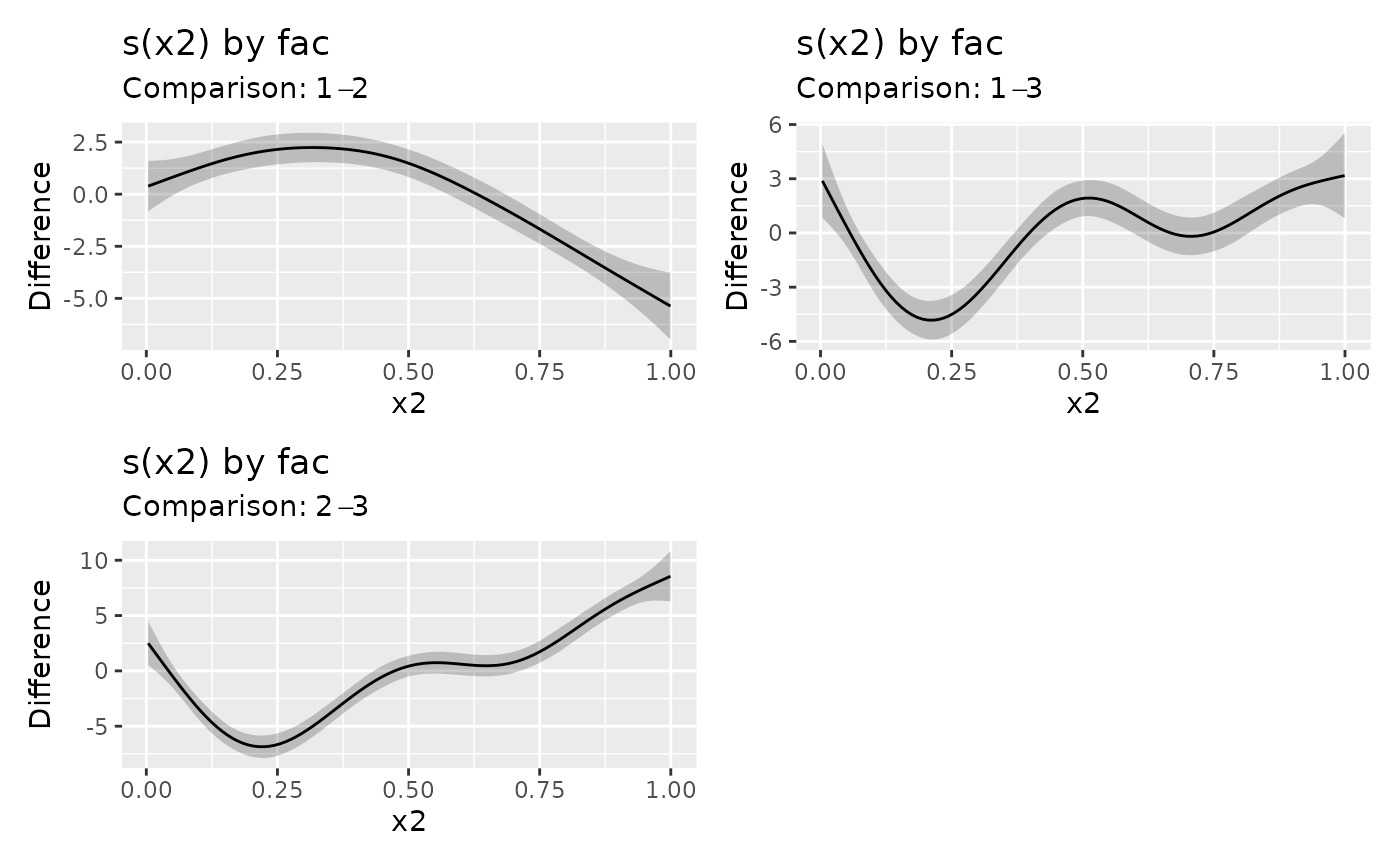
load_mgcv()
# simulate some data; a factor smooth example
df <- data_sim("eg4", seed = 42)
# fit GAM
m <- gam(y ~ fac + s(x2, by = fac) + s(x0), data = df, method = "REML")

# calculate the differences between pairs of smooths the f_j(x2) term
diffs <- difference_smooths(m, select = "s(x2)")
draw(diffs)