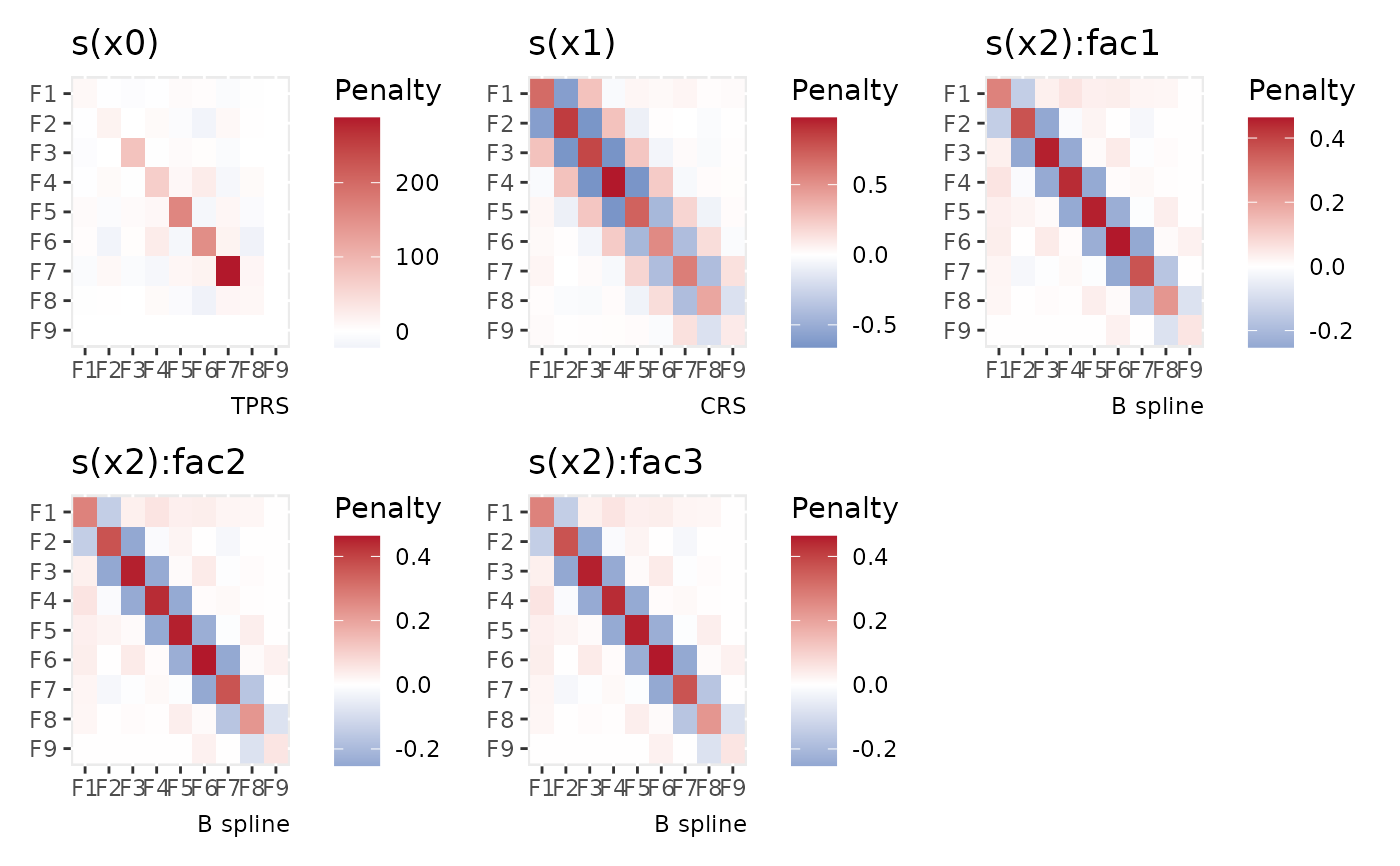
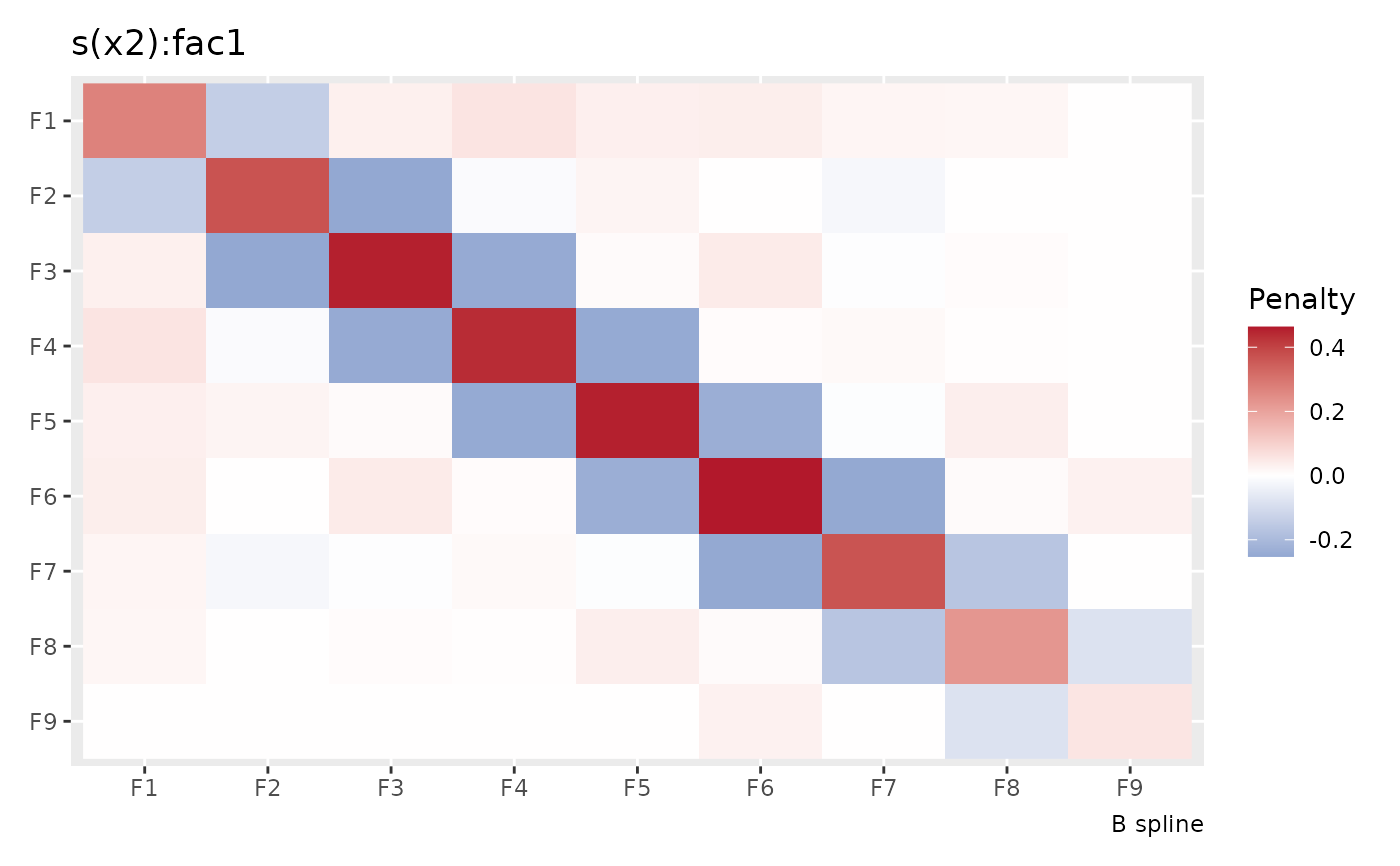
Displays the penalty matrices of smooths as a heatmap using ggplot
Usage
# S3 method for class 'penalty_df'
draw(
  object,
  normalize = FALSE,
  as_matrix = TRUE,
  continuous_fill = NULL,
  xlab = NULL,
  ylab = NULL,
  title = NULL,
  subtitle = NULL,
  caption = NULL,
  ncol = NULL,
  nrow = NULL,
  guides = "keep",
  ...
)
Arguments
- object
a fitted GAM, the result of a call to
mgcv::gam().- normalize
logical; normalize the penalty to the range -1, 1?
- as_matrix
logical; how should the plotted penalty matrix be oriented? If
TRUErow 1, column 1 of the penalty matrix is draw in the upper left, whereas, ifFALSEit is drawn in the lower left of the plot.- continuous_fill
a suitable fill scale to be used when plotting continuous variables.
- xlab
character or expression; the label for the x axis. If not supplied, no axis label will be drawn. May be a vector, one per penalty.
- ylab
character or expression; the label for the y axis. If not supplied, no axis label will be drawn. May be a vector, one per penalty.
- title
character or expression; the title for the plot. See
ggplot2::labs(). May be a vector, one per penalty.- subtitle
character or expression; the subtitle for the plot. See
ggplot2::labs(). May be a vector, one per penalty.- caption
character or expression; the plot caption. See
ggplot2::labs(). May be a vector, one per penalty.- ncol, nrow
numeric; the numbers of rows and columns over which to spread the plots.
- guides
character; one of
"keep"(the default),"collect", or"auto". Passed topatchwork::plot_layout()- ...
additional arguments passed to
patchwork::wrap_plots().