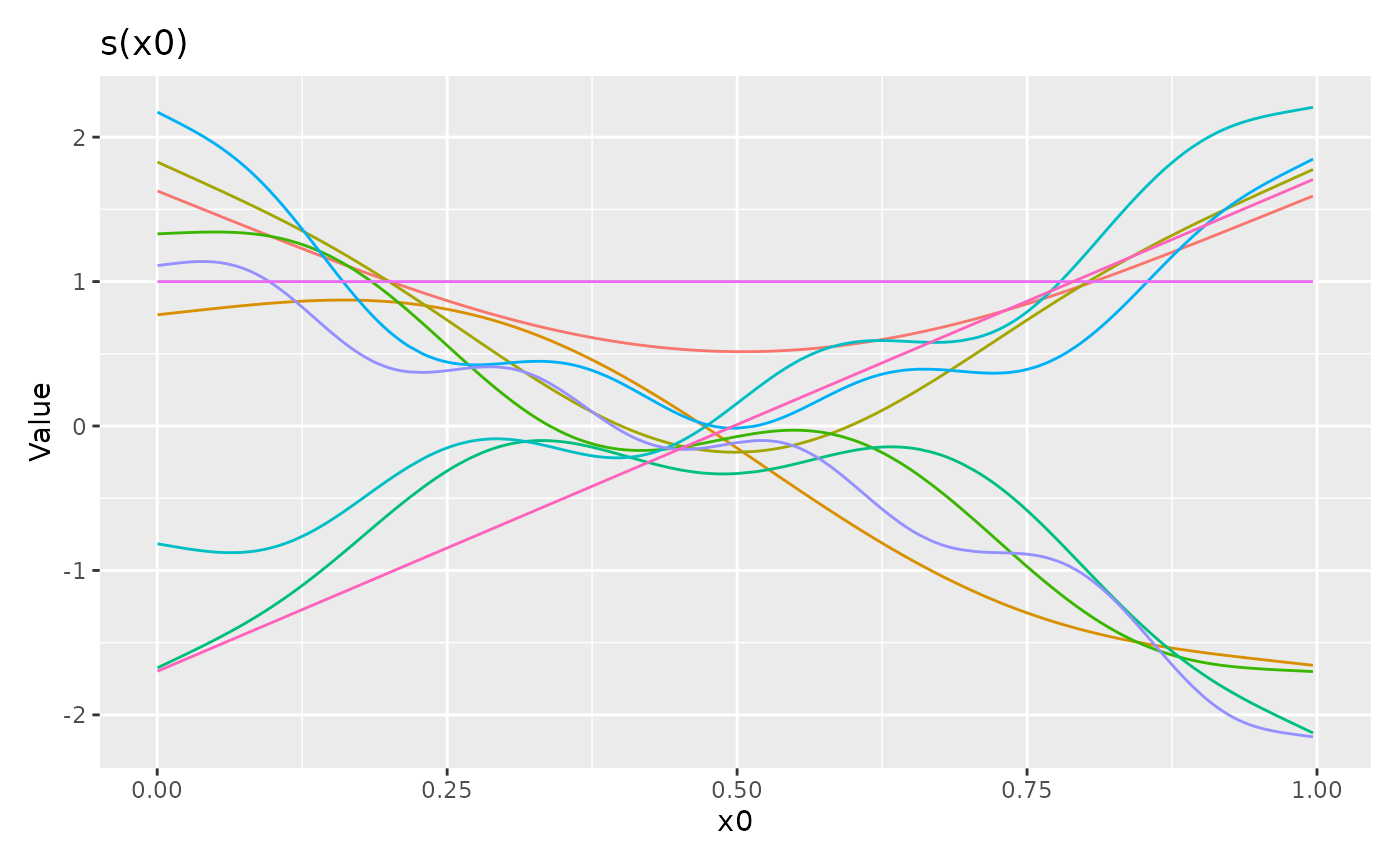
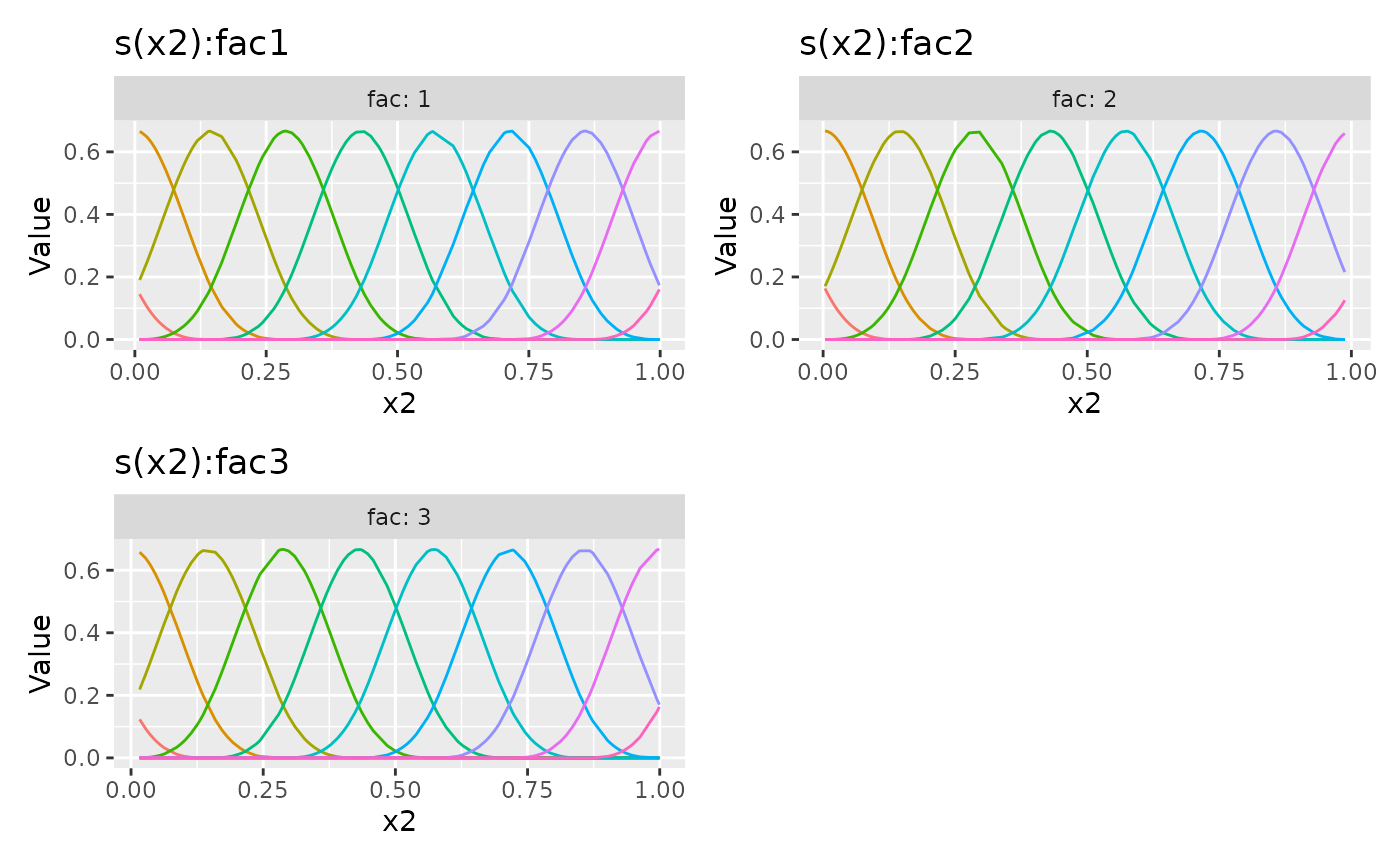
Plots basis functions using ggplot2
Usage
# S3 method for class 'mgcv_smooth'
draw(
  object,
  legend = FALSE,
  use_facets = TRUE,
  labeller = NULL,
  xlab,
  ylab,
  title = NULL,
  subtitle = NULL,
  caption = NULL,
  angle = NULL,
  ...
)
Arguments
- object
an object, the result of a call to
basis().- legend
logical; should a legend by drawn to indicate basis functions?
- use_facets
logical; for factor by smooths, use facets to show the basis functions for each level of the factor? If
FALSE, a separate ggplot object will be created for each level and combined usingpatchwork::wrap_plots(). Currently ignored.- labeller
a labeller function with which to label facets. The default is to use
ggplot2::label_both().- xlab
character or expression; the label for the x axis. If not supplied, a suitable label will be generated from
object.- ylab
character or expression; the label for the y axis. If not supplied, a suitable label will be generated from
object.- title
character or expression; the title for the plot. See
ggplot2::labs().- subtitle
character or expression; the subtitle for the plot. See
ggplot2::labs().- caption
character or expression; the plot caption. See
ggplot2::labs().- angle
numeric; the angle at which the x axis tick labels are to be drawn passed to the
angleargument ofggplot2::guide_axis().- ...
arguments passed to other methods. Not used by this method.
Value
A ggplot2::ggplot() object.