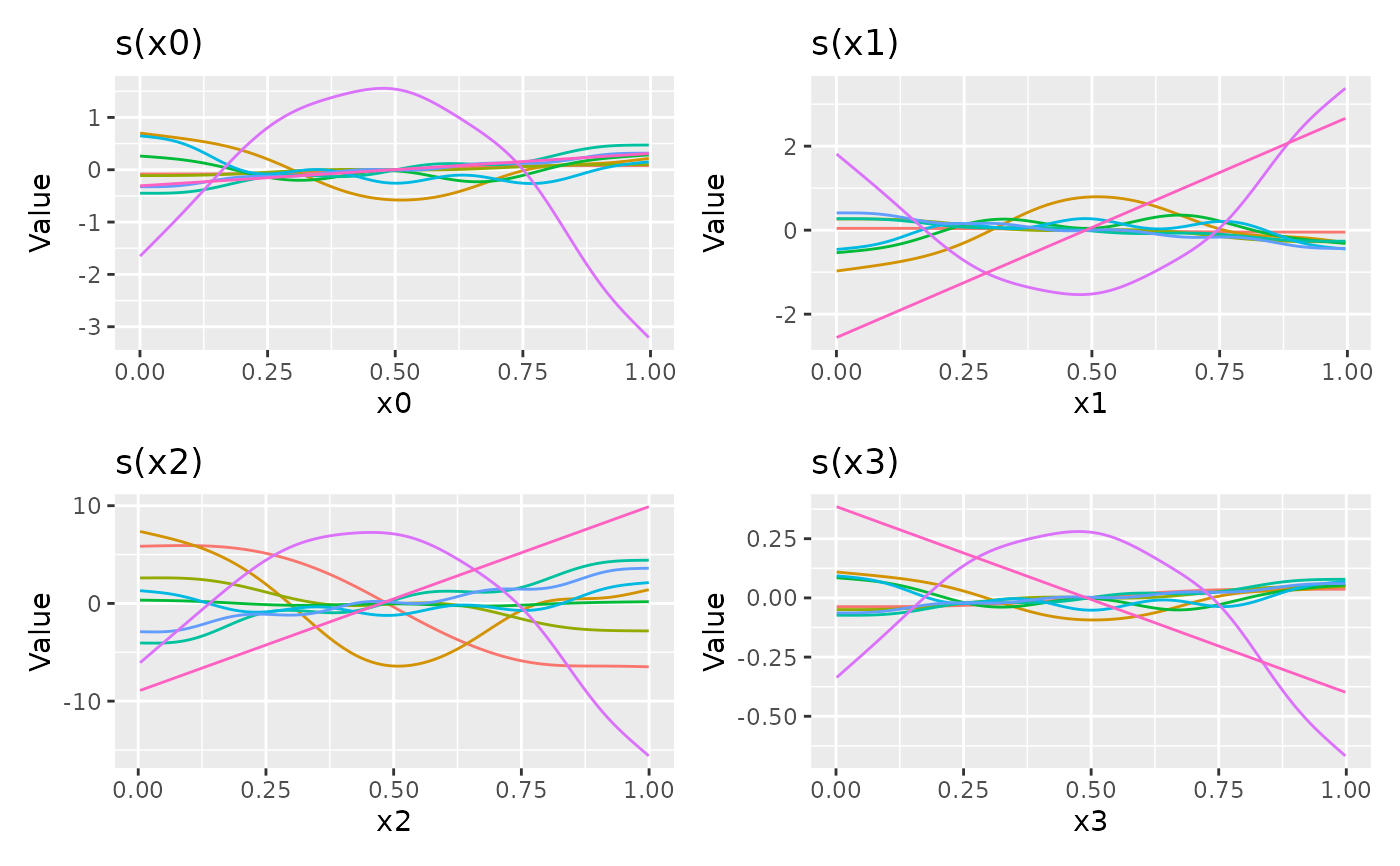
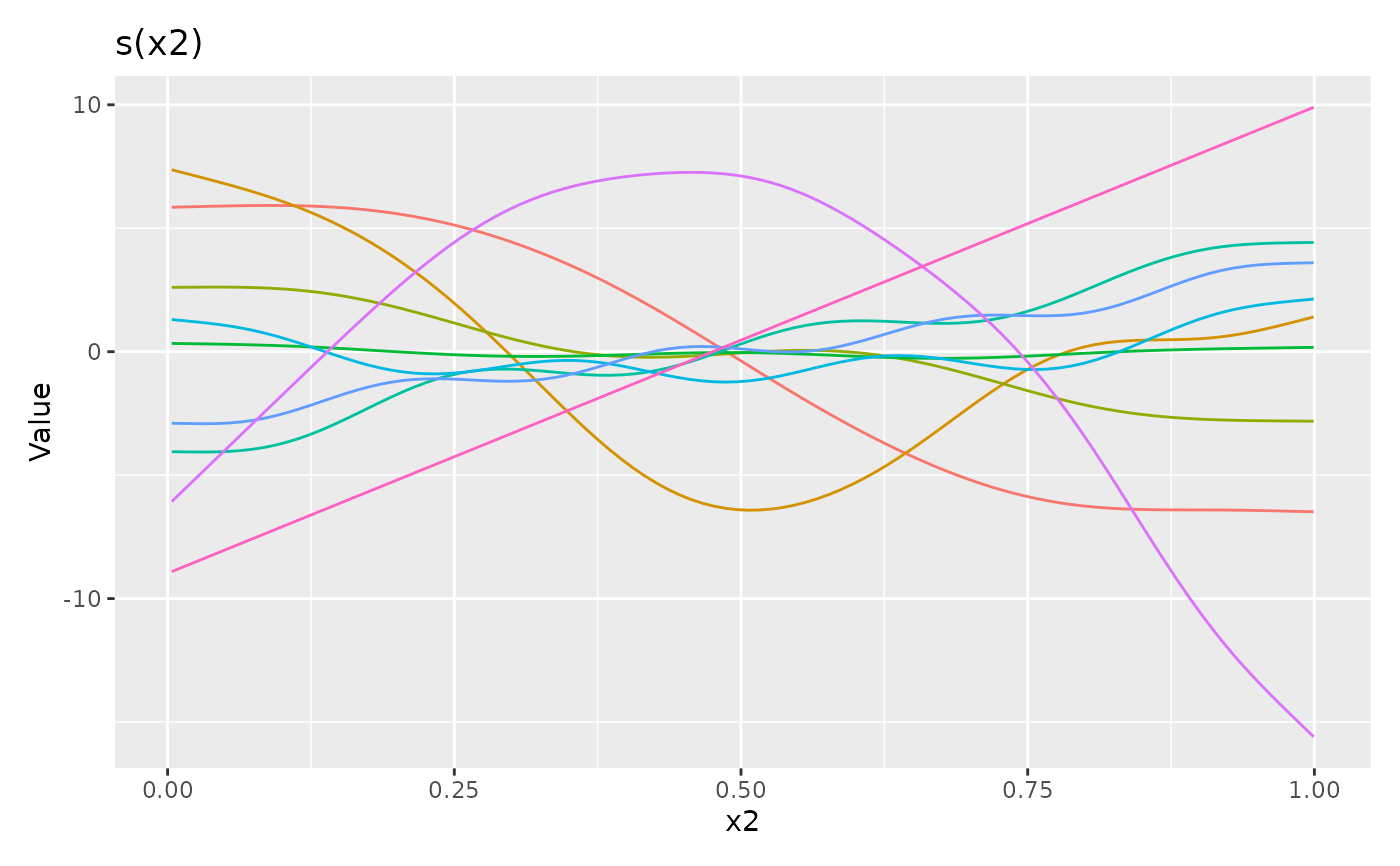
Plots basis functions using ggplot2
Usage
# S3 method for class 'basis'
draw(
  object,
  legend = FALSE,
  labeller = NULL,
  ylab = NULL,
  title = NULL,
  subtitle = NULL,
  caption = NULL,
  ncol = NULL,
  nrow = NULL,
  angle = NULL,
  guides = "keep",
  contour = FALSE,
  n_contour = 10,
  contour_col = "black",
  ...
)
Arguments
- object
an object, the result of a call to
basis().- legend
logical; should a legend by drawn to indicate basis functions?
- labeller
a labeller function with which to label facets. The default is to use
ggplot2::label_both().- ylab
character or expression; the label for the y axis. If not supplied, a suitable label will be generated from
object.- title
character or expression; the title for the plot. See
ggplot2::labs().- subtitle
character or expression; the subtitle for the plot. See
ggplot2::labs().- caption
character or expression; the plot caption. See
ggplot2::labs().- ncol, nrow
numeric; the numbers of rows and columns over which to spread the plots
- angle
numeric; the angle at which the x axis tick labels are to be drawn passed to the
angleargument ofggplot2::guide_axis().- guides
character; one of
"keep"(the default),"collect", or"auto". Passed topatchwork::plot_layout()- contour
logical; should contours be draw on the plot using
ggplot2::geom_contour().- n_contour
numeric; the number of contour bins. Will result in
n_contour - 1contour lines being drawn. Seeggplot2::geom_contour().- contour_col
colour specification for contour lines.
- ...
arguments passed to other methods. Not used by this method.