
Conditional predictions from a GAM
Source:R/conditional-values.R, R/gamm4-methods.R, R/scam-methods.R
conditional_values.RdGenerate predicted values from a GAM, conditional upon supplied values of
covariates. conditional_values() is modelled after
marginaleffects::plot_predictions(), but with an intentionally simpler,
more restrictive functionality. The intended use case is for quickly
visualizing predicted values from a fitted GAM on the response scale. For
more complex model predictions, you are strongly encouraged to use
marginaleffects::plot_predictions().
Usage
conditional_values(
  model,
  condition = NULL,
  data = NULL,
  scale = c("response", "link", "linear_predictor"),
  ...
)

# S3 method for class 'gam'
conditional_values(
  model,
  condition = NULL,
  data = NULL,
  scale = c("response", "link", "linear_predictor"),
  n_vals = 100,
  ci_level = 0.95,
  complete = TRUE,
  ...
)

# S3 method for class 'gamm4'
conditional_values(model, ...)

# S3 method for class 'scam'
conditional_values(model, ..., unconditional = FALSE)
Arguments
- model
a fitted GAM object.
- condition
either a character vector or a list supplying the names of covariates, and possibly their values, to condition up. The order of the values determines how these are plotted via the
draw.conditional_values()method; the first element is mapped to the x channel, the second element to the colour channel, the third toggplot2::facet_wrap()if no fourth element is present, if present, the fourth element is mapped to the rows and the third element is mapped to the columns ofggplot2::facet_grid().- data
optional data frame used to generate condition values and determine covariate classes. Explicit values in
conditiontake precedence. Other covariates use the fitted model's typical values. The rows ofdataare not used directly as a prediction grid.- scale
character; which scale should predictions be returned on?
- ...
arguments passed to
fitted_values().- n_vals
numeric; number of values to generate for numeric variables named in
condition.- ci_level
numeric; a number on interval (0,1) giving the coverage for credible intervals.
- complete
logical; if
TRUE(the default), retain all combinations of conditions. IfFALSE, retain only combinations of factor levels among the variables named inconditionthat occur in the fitted model's data. Numeric conditions are not filtered, and variables absent fromconditionremain at their typical values. Supplieddatadoes not change which combinations count as observed. An error is raised if no combinations remain.- unconditional
logical; include smoothing parameter uncertainty in the Bayesian covariance matrix, if available. Otherwise a warning is issued and the uncorrected covariance is used.
Examples
load_mgcv()
df <- data_sim("eg1", seed = 2)
m1 <- gam(y ~ s(x0) + s(x1) + s(x2) + s(x3), data = df, method = "REML")
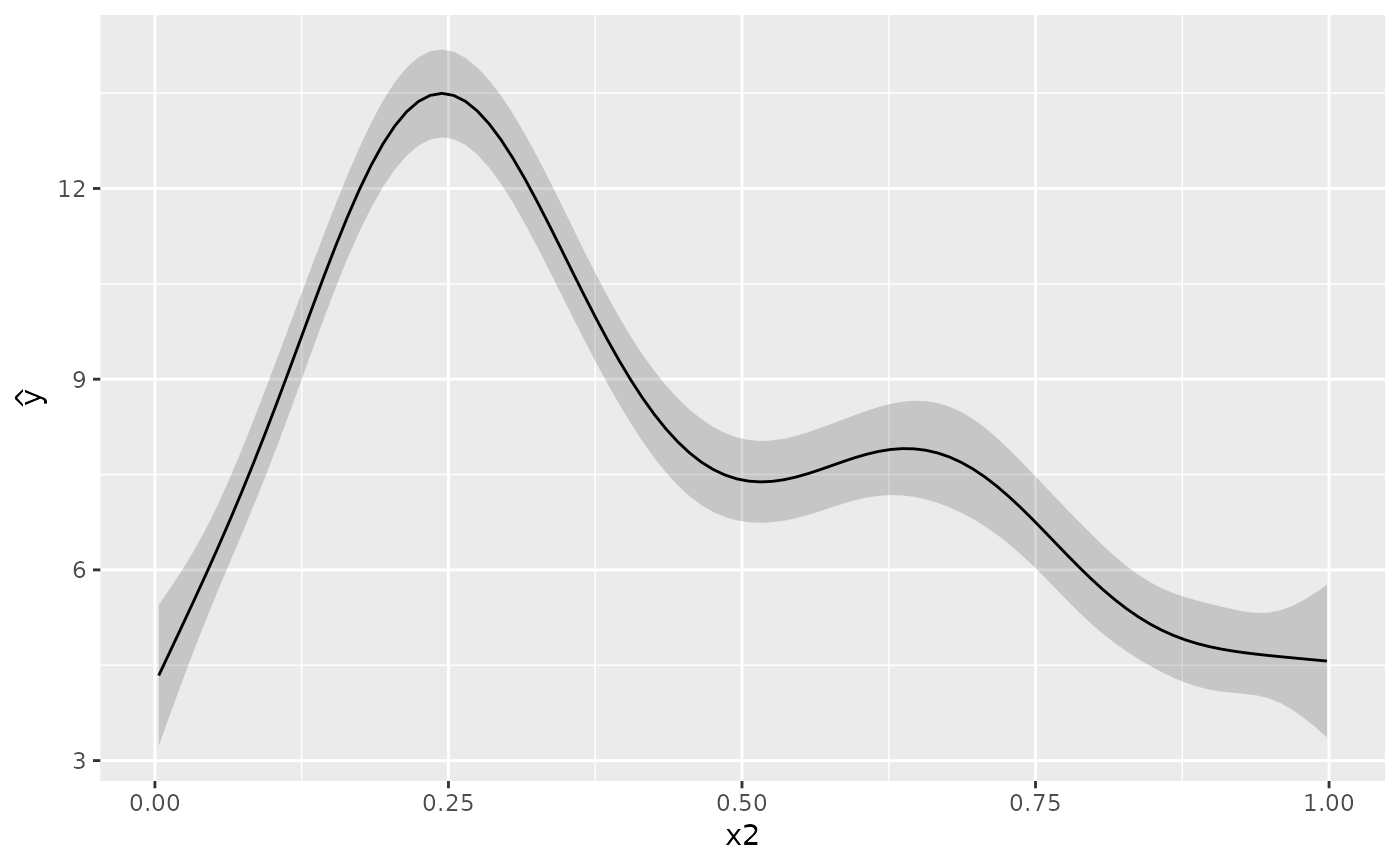
# predictions conditional on values evenly spaced over x2, all other
# variables in model are held at representative values
cv <- conditional_values(
m1,
condition = "x2"
)
# plot
cv |> draw()
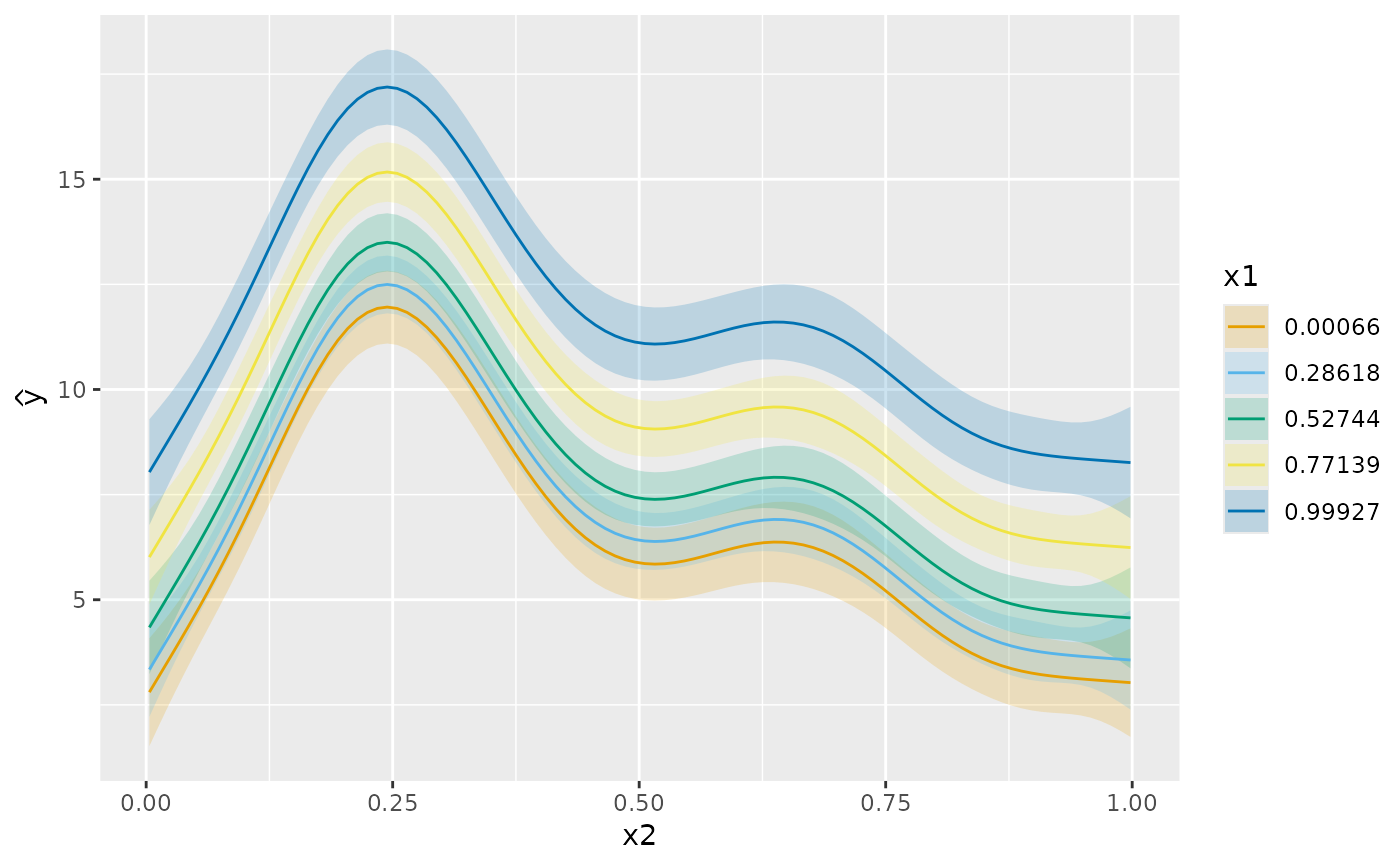
 # as above but condition on `x1` also. When plotted, `x1` is mapped to the
# colour channel, noting that it has been summarised using fivenum()
cv <- conditional_values(
m1,
condition = c("x2", "x1")
)
# plot
cv |> draw()
# as above but condition on `x1` also. When plotted, `x1` is mapped to the
# colour channel, noting that it has been summarised using fivenum()
cv <- conditional_values(
m1,
condition = c("x2", "x1")
)
# plot
cv |> draw()
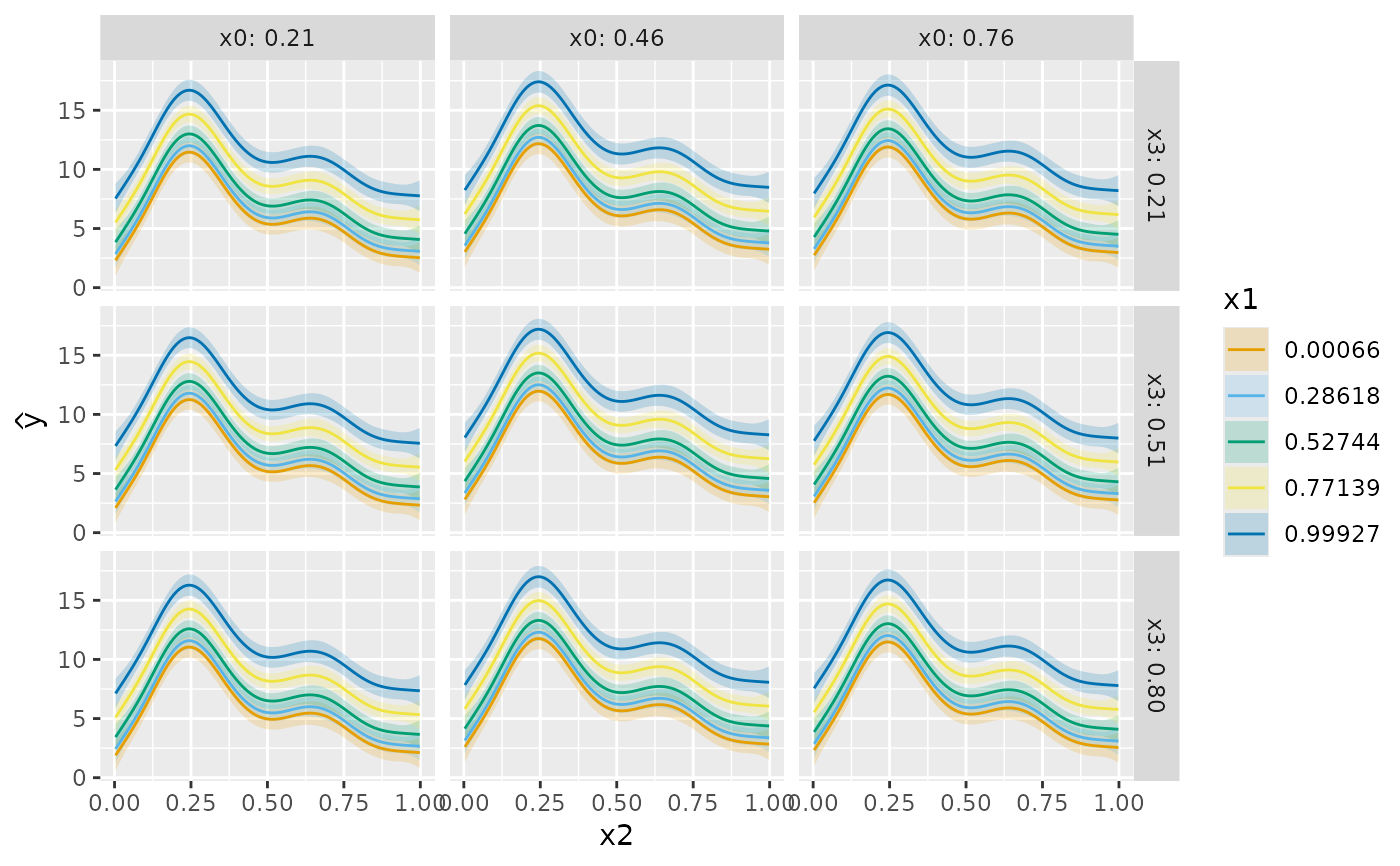
 # can pass `condition` a list, allowing for greater flexibility
# For example, here we condition on all four variables in the model,
# summarising:
# * `x1` at its five number summary,
# * `x0 at its quartiles
# * `x3` at its mean a d mean +/- sd
cv <- conditional_values(
m1,
condition = list("x2", x1 = "fivenum", x0 = "quartile", x3 = "threenum")
)
# plot
cv |> draw()
# can pass `condition` a list, allowing for greater flexibility
# For example, here we condition on all four variables in the model,
# summarising:
# * `x1` at its five number summary,
# * `x0 at its quartiles
# * `x3` at its mean a d mean +/- sd
cv <- conditional_values(
m1,
condition = list("x2", x1 = "fivenum", x0 = "quartile", x3 = "threenum")
)
# plot
cv |> draw()
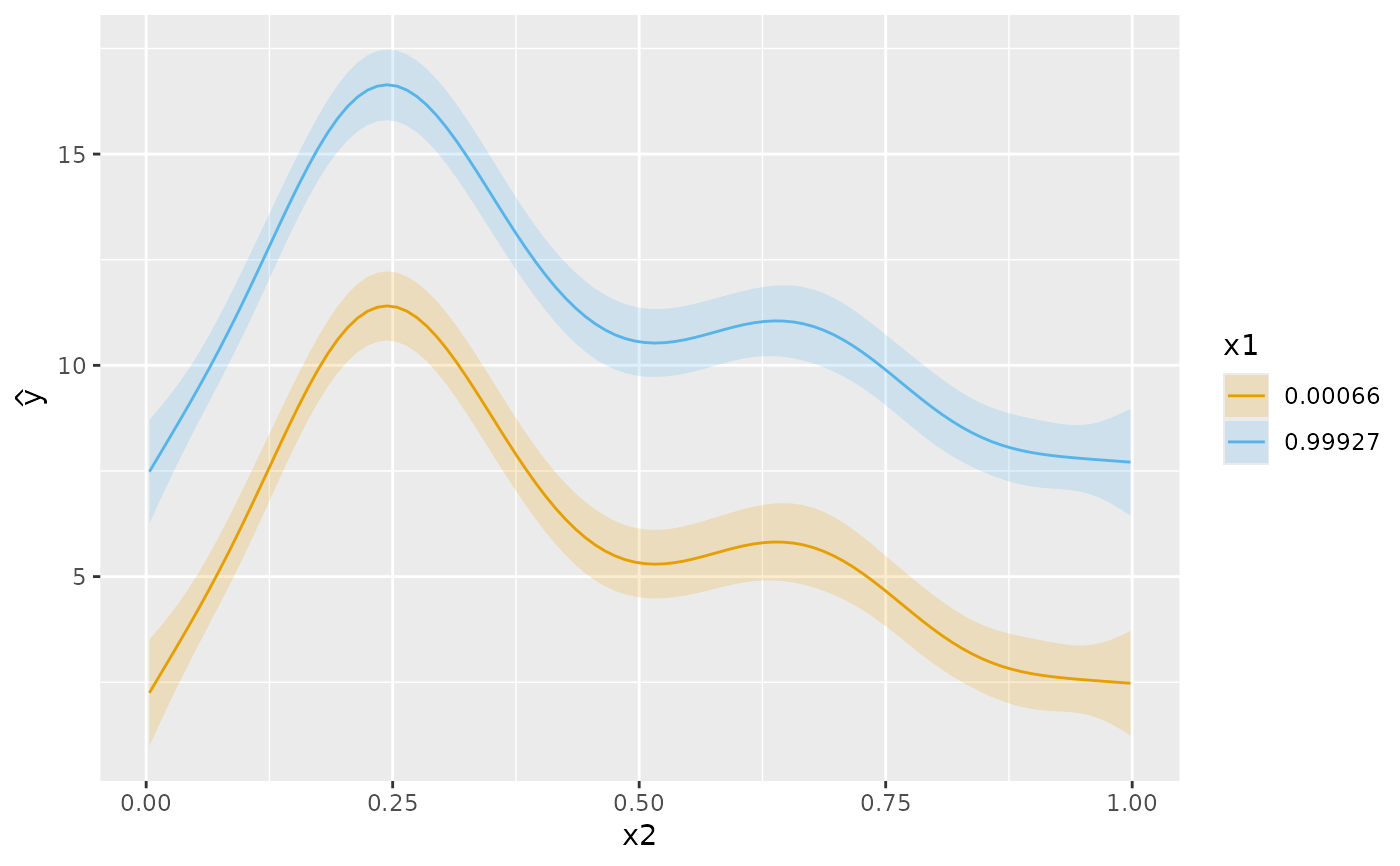
 # some model terms can be exclude from the conditional predictions using the
# `exclude` mechanism of `predict.gam`. Here we exclude the effects of
# `s(x0)` and `s(x3)` from the conditional predictions. This, in effect,
# treats these smooths as having **0** effect on the conditional predictions
# of the response, even though the two smooths conditioned on (`s(x2)` and
# `s(x1)`) were estimated given the two excluded smooths were in the model
cv <- conditional_values(
m1,
condition = list("x2", x1 = "minmax"),
exclude = c("s(x0)", "s(x3)")
)
# plot
cv |> draw()
# some model terms can be exclude from the conditional predictions using the
# `exclude` mechanism of `predict.gam`. Here we exclude the effects of
# `s(x0)` and `s(x3)` from the conditional predictions. This, in effect,
# treats these smooths as having **0** effect on the conditional predictions
# of the response, even though the two smooths conditioned on (`s(x2)` and
# `s(x1)`) were estimated given the two excluded smooths were in the model
cv <- conditional_values(
m1,
condition = list("x2", x1 = "minmax"),
exclude = c("s(x0)", "s(x3)")
)
# plot
cv |> draw()
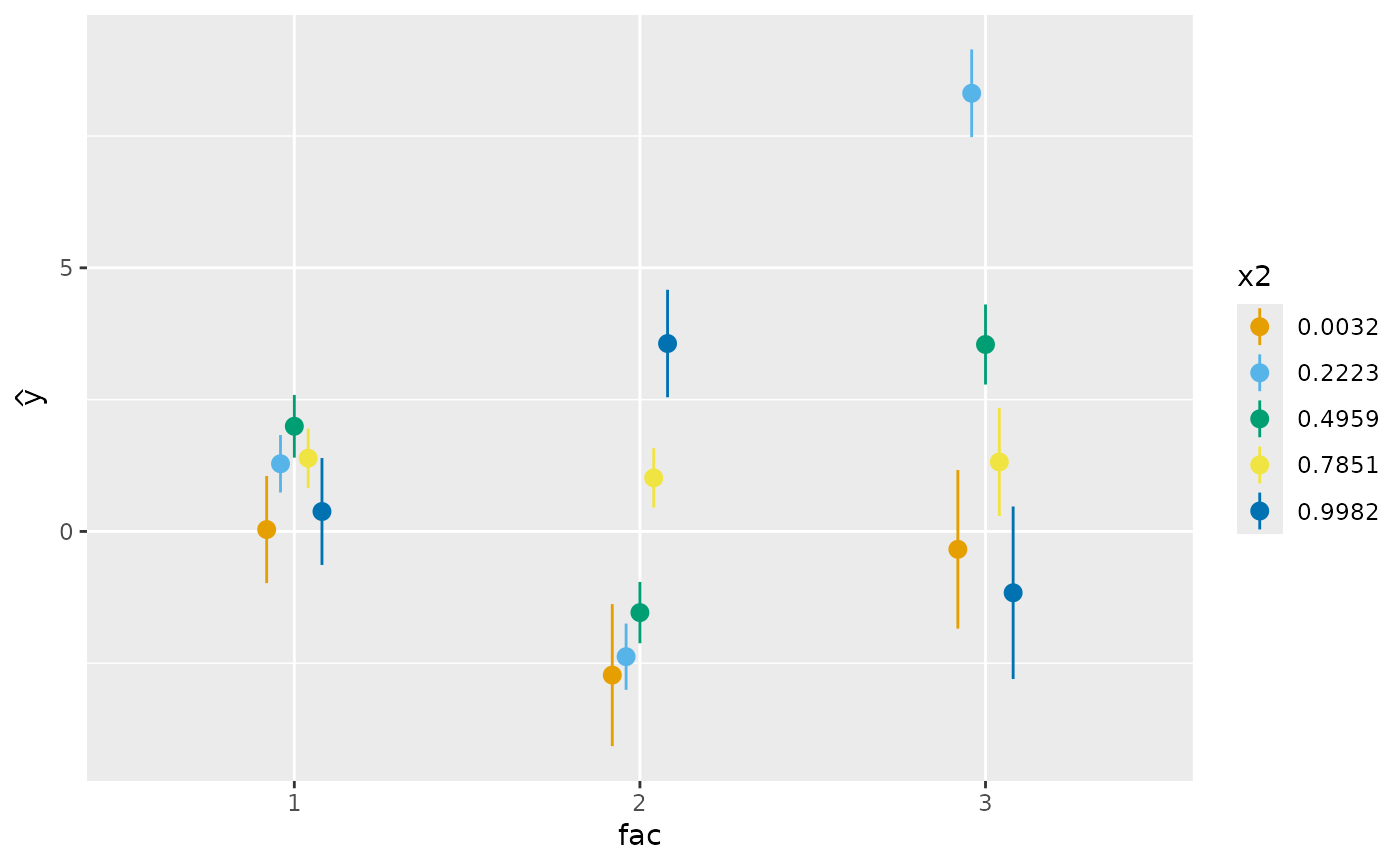
 # categorical conditions are also handled
df <- data_sim("eg4", seed = 2)
m2 <- gam(y ~ fac + s(x2, by = fac) + s(x0), data = df, method = "REML")
cv <- conditional_values(
m2,
condition = list("fac", x2 = "fivenum")
)
# plot - we see a discrete x axis
cv |> draw()
# categorical conditions are also handled
df <- data_sim("eg4", seed = 2)
m2 <- gam(y ~ fac + s(x2, by = fac) + s(x0), data = df, method = "REML")
cv <- conditional_values(
m2,
condition = list("fac", x2 = "fivenum")
)
# plot - we see a discrete x axis
cv |> draw()
 # in this example we condition on `x2` and `fac %in% c(2,3)`
cv <- conditional_values(
m2,
condition = list("x2", fac = 2:3)
)
# plot - smooths of `x2` for `fac == 2` and `fac == 3`
cv |> draw()
# in this example we condition on `x2` and `fac %in% c(2,3)`
cv <- conditional_values(
m2,
condition = list("x2", fac = 2:3)
)
# plot - smooths of `x2` for `fac == 2` and `fac == 3`
cv |> draw()
