Compare smooths across models
Usage
compare_smooths(
  model,
  ...,
  select = NULL,
  smooths = deprecated(),
  n = 100,
  n_2d = 50,
  data = NULL,
  unconditional = FALSE,
  overall_uncertainty = TRUE,
  partial_match = FALSE,
  envir = NULL,
  dist = NULL
)
Arguments
- model
Primary model for comparison.
- ...
Additional models to compare smooths against those of
model.- select
character; select which smooths to compare. The default (
NULL) means all smooths inmodelwill be compared. Numericselectindexes the smooths in the order they are specified in the formula and stored inmodel. Characterselectmatches the labels for smooths as shown for example in the output fromsummary(object). Logicalselectoperates as per numericselectin the order that smooths are stored.- smooths
 Use
selectinstead.- n
numeric; the number of points over the range of the covariate at which to evaluate a univariate smooth.
- n_2d
numeric; the number of points along each of the first two axes of a smooth surface, including surface panels of higher-dimensional smooths. The default is 50 in plotting and plot-preparation functions. If
NULL, useninstead. Ignored when evaluationdataare supplied. Factor levels are retained, and curves with only one continuous covariate usen.- data
a data frame of covariate values at which to evaluate the smooth.
- unconditional
logical; if
TRUE(and only iffrequentist == FALSE) then the bayesian smoothing parameter uncertainty-corrected covariance matrix is returned, if available. Whether it is available depends on which smoothness selection method was used to fit the model.- overall_uncertainty
logical; should the uncertainty in the model constant term be included in the standard error of the evaluate values of the smooth?
- partial_match
logical; should smooths be selected by partial matches with
select? IfTRUE,selectcan only be a single string to match against.- envir
an optional environment supplying functions and constants used in model expressions. The available model formula environment is used when
NULL. Covariate observations should be supplied indata.- dist
numeric; if greater than 0, this is used to determine when a location is too far from data to be plotted when plotting 2-D smooths. The data are scaled into the unit square before deciding what to exclude, and
distis a distance within the unit square. Seemgcv::exclude.too.far()for further details.
Details
Two-variable smooths are evaluated at common locations. Automatic grids span
the intersection of the models' observed covariate ranges; factor levels must
overlap. Supplied data are evaluated as given, without filling gaps.
Each selected smooth label must occur exactly once in every model and use
the same covariates, including any by variable. Numeric and logical select
refer to the primary model; matching labels are then used in every model.
Estimates are contributions of individual smooths to the linear predictor, on its link scale, with the centring constraints used in each fitted model. They exclude the intercept and other model terms. Different fitting data can change the centring, so a surface difference can include a constant shift. It is the difference between these fitted smooth contributions, rather than a difference between fitted responses.
The result retains one row per model and smooth, with estimates in the data
list column. For distributional models, .parameter retains the label for
the linear predictor, while .model identifies the input model. Use
draw.compare_smooths() for faceted surface comparisons or
estimated surface differences. Smooths with more than two covariates can be
evaluated but cannot be drawn by this method.
Examples
load_mgcv()
dat <- data_sim("eg1", seed = 2)
## models to compare smooths across - artificially create differences
m1 <- gam(y ~ s(x0, k = 5) + s(x1, k = 5) + s(x2, k = 5) + s(x3, k = 5),
data = dat, method = "REML"
)
m2 <- gam(y ~ s(x0, bs = "ts") + s(x1, bs = "ts") + s(x2, bs = "ts") +
s(x3, bs = "ts"), data = dat, method = "REML")
## build comparisons
comp <- compare_smooths(m1, m2)
comp
#> # A tibble: 8 x 5
#> .model .smooth .type .by data
#> <chr> <chr> <chr> <chr> <list>
#> 1 m1 s(x0) TPRS NA <tibble [100 x 3]>
#> 2 m2 s(x0) TPRS (shrink) NA <tibble [100 x 3]>
#> 3 m1 s(x1) TPRS NA <tibble [100 x 3]>
#> 4 m2 s(x1) TPRS (shrink) NA <tibble [100 x 3]>
#> 5 m1 s(x2) TPRS NA <tibble [100 x 3]>
#> 6 m2 s(x2) TPRS (shrink) NA <tibble [100 x 3]>
#> 7 m1 s(x3) TPRS NA <tibble [100 x 3]>
#> 8 m2 s(x3) TPRS (shrink) NA <tibble [100 x 3]>
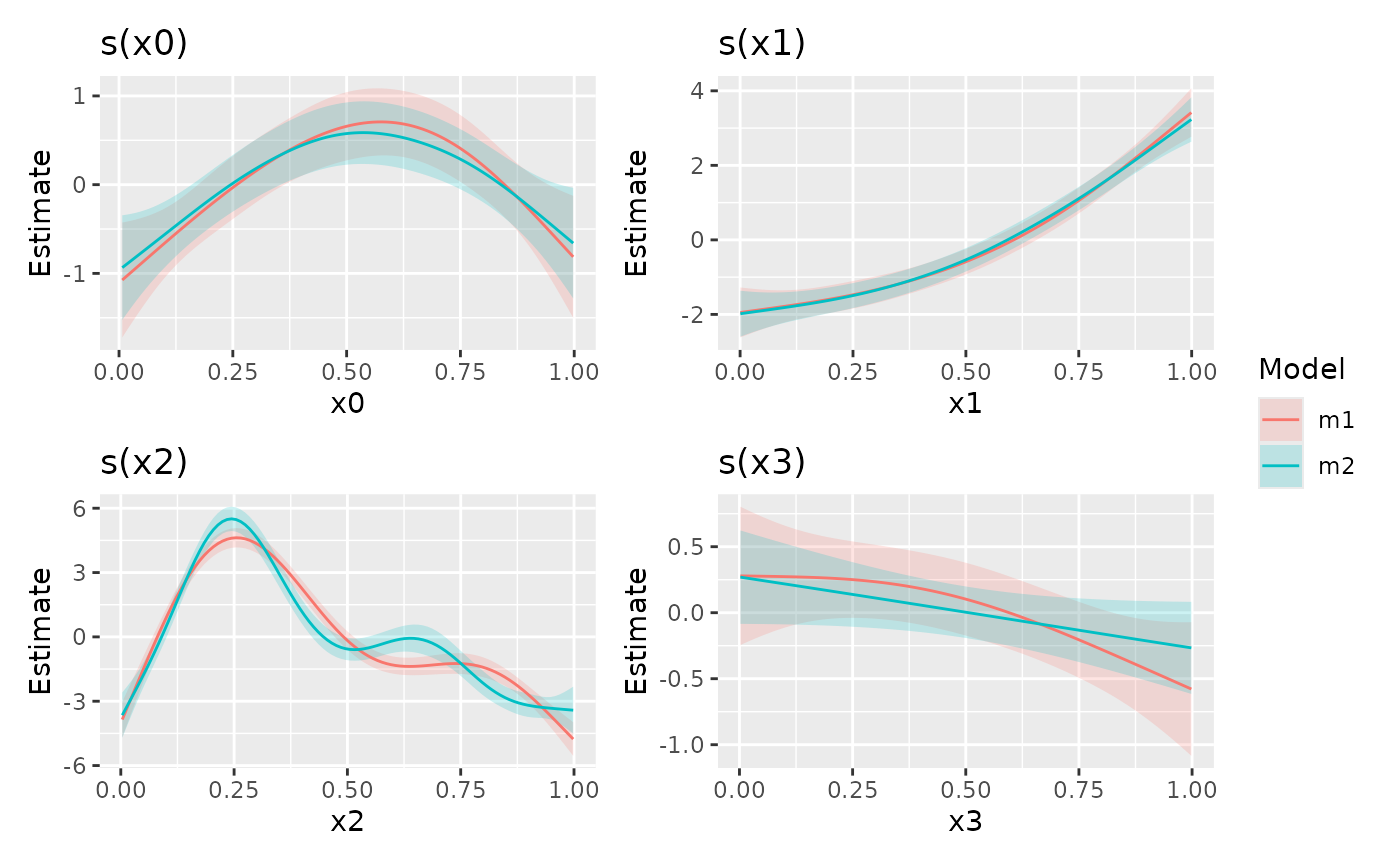
## notice that the result is a nested tibble
draw(comp)
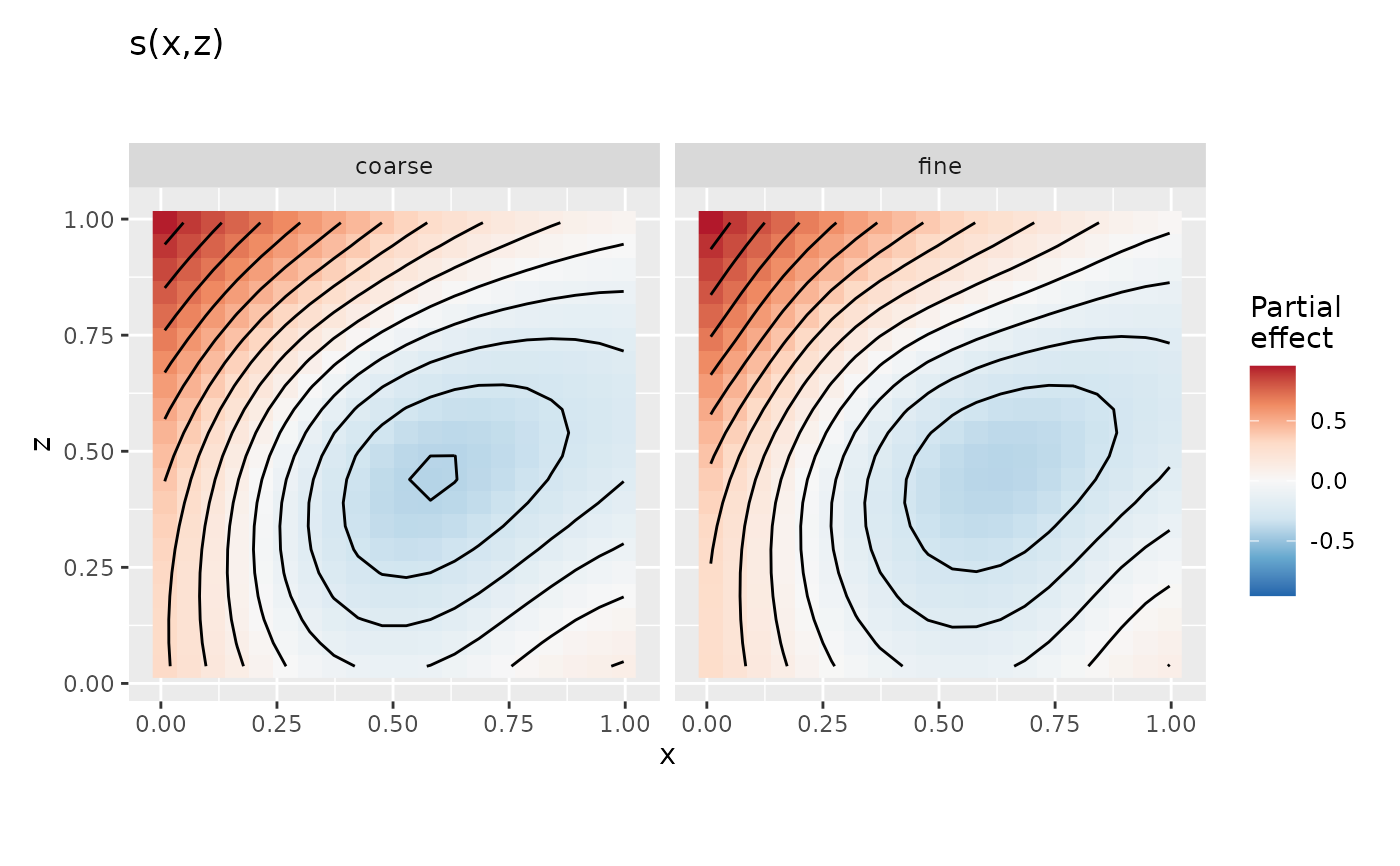
 # Simulate a noisy response over two continuous covariates, x and z
surf <- data_sim("eg2", n = 100, seed = 7)
# Fit two small bases to the same surface data
coarse <- gam(y ~ s(x, z, k = 10), data = surf, method = "REML")
fine <- gam(y ~ s(x, z, k = 15), data = surf, method = "REML")
# Compare surfaces on shared axes and a shared colour scale
surfaces <- compare_smooths(coarse, fine, n_2d = 20)
draw(surfaces)
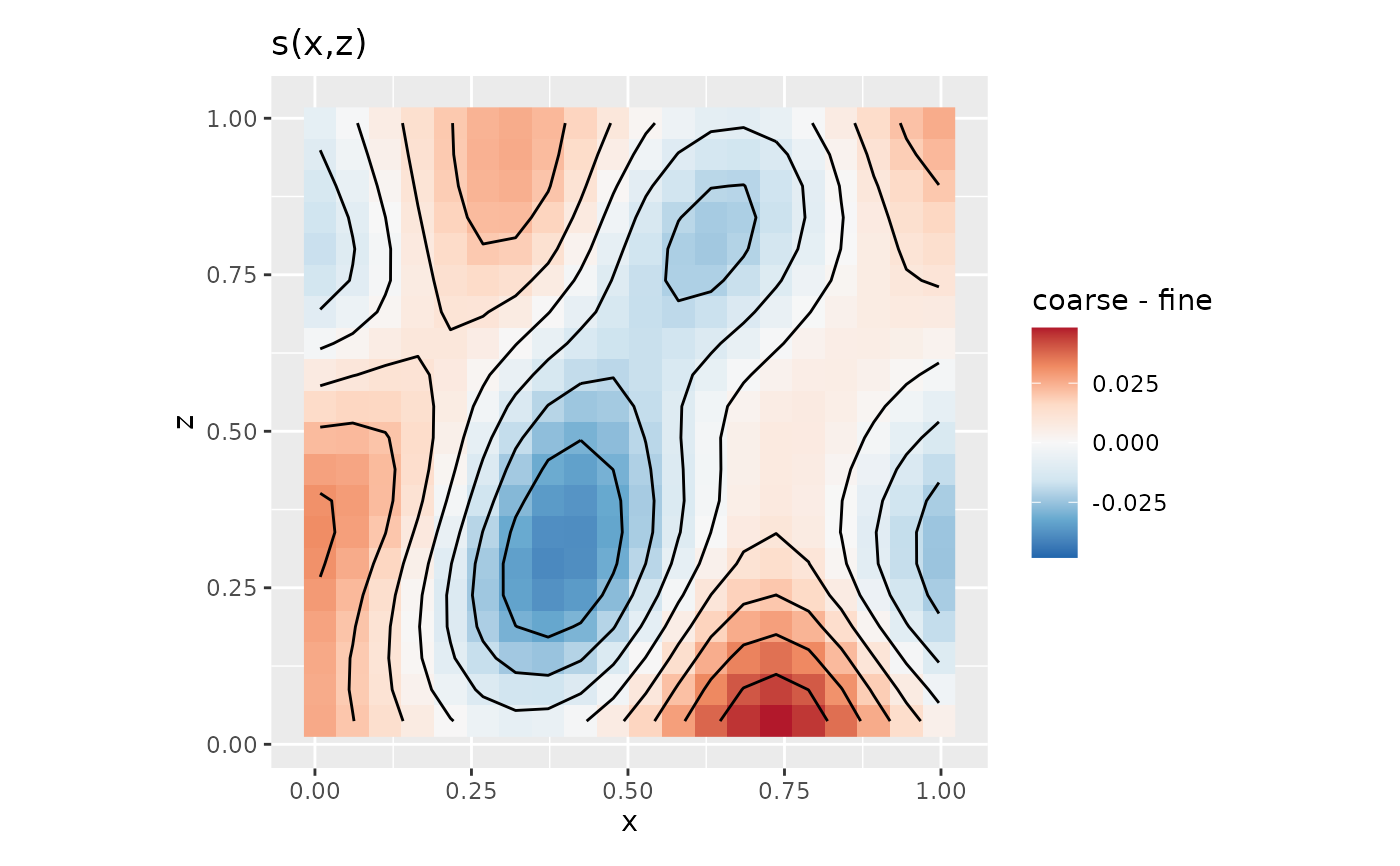
 # Show coarse minus fine, with a colour scale centred on zero
draw(surfaces, show = "difference", pair = c("coarse", "fine"))