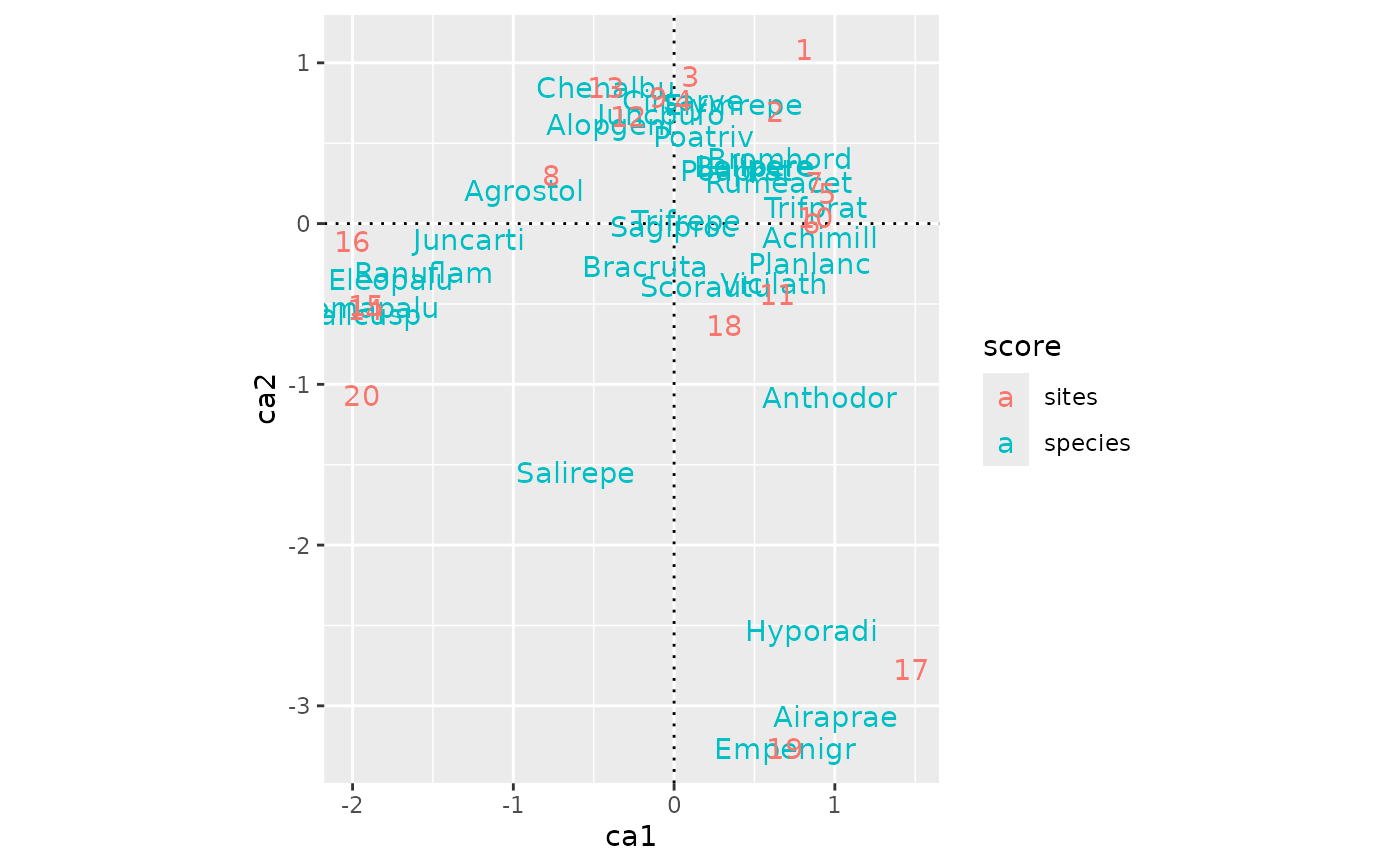
The origin (coordinates 0,0) has a special interpretation in
eigenvector methods: sites, species or variables at the centroid
are average cases, and the point is more exceptional the further it
is from the origin. Therefore crosshair of axes through the origin
should be added to the ordination graph with eigenvector
methods. Often it is forgotten, though. See the Example in
geom_ordi_arrow() where the length of PCA biplot arrow shows how
exceptional the species is in ordination.
Arguments
- lty
Linetype.
- ...
other arguments passed to
ggplot2::geom_hline()andggplot2::geom_vline()
See also
The underlying functions are ggplot2::geom_hline() and
ggplot2::geom_vline().