ggplot-based plot for objects of class "poolaccum"
Source: R/autoplot.poolaccum.R
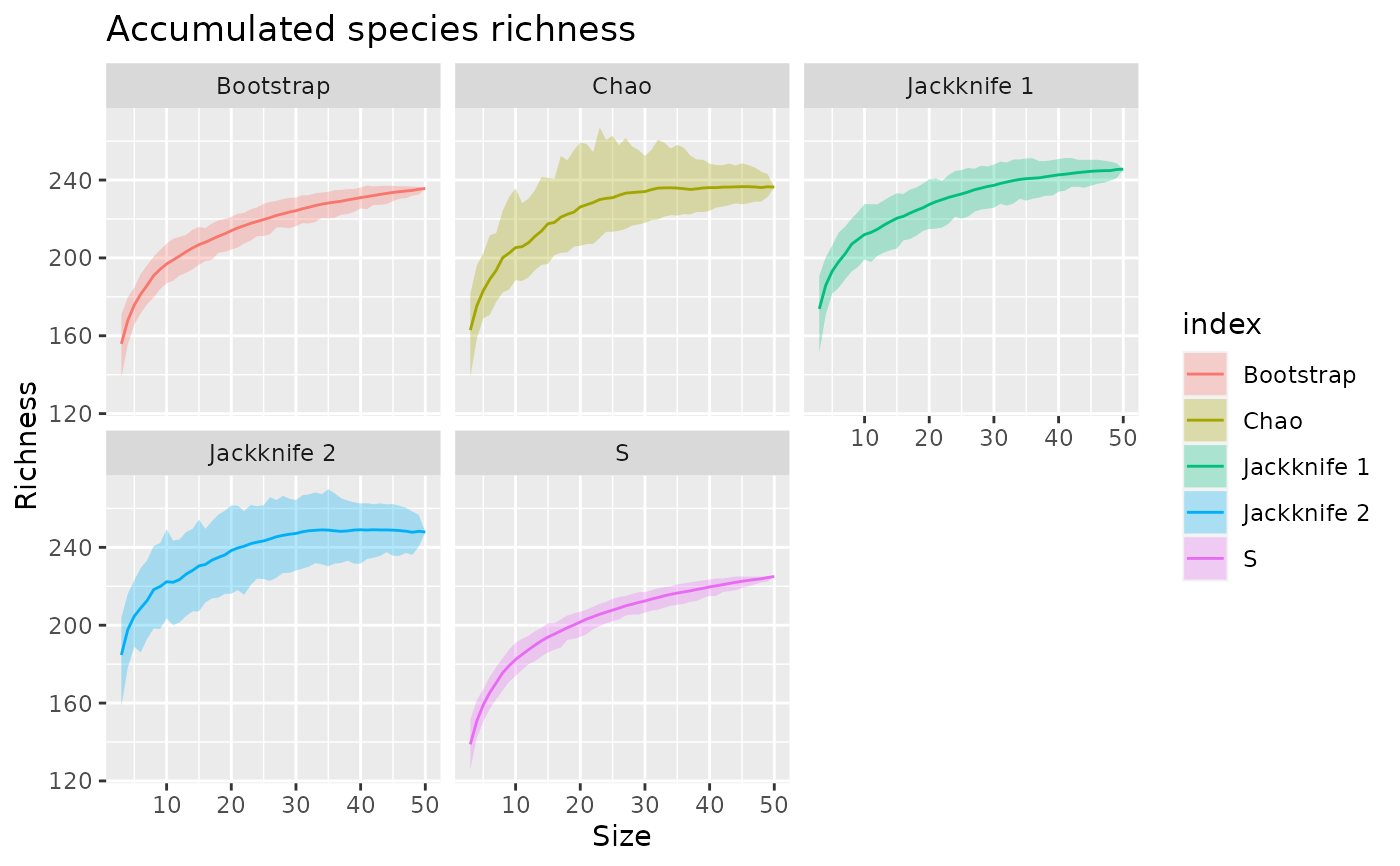
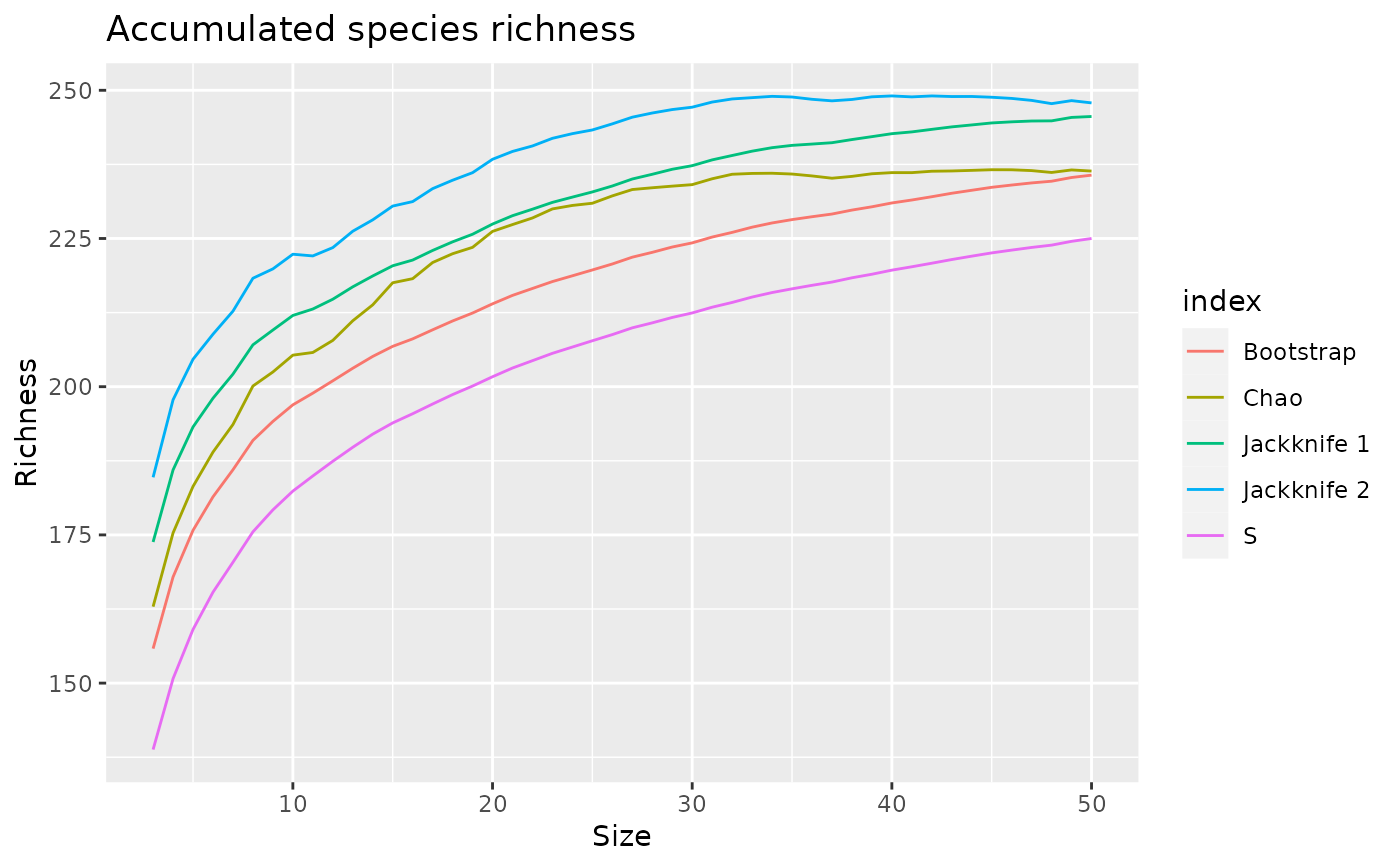
autoplot.poolaccum.RdProduces a multi-layer ggplot object representing the output of objects
produced by vegan::poolaccum().
Usage
# S3 method for class 'poolaccum'
autoplot(
  object,
  facet = TRUE,
  ribbon = facet,
  ncol = NULL,
  ribbon.alpha = 0.3,
  xlab = "Size",
  ylab = "Richness",
  title = "Accumulated species richness",
  subtitle = NULL,
  caption = NULL,
  ...
)
Arguments
- object
an object of class
"poolaccum", the result of a call tovegan::poolaccum().- facet
logical; should extrapolated richness estimators be shown in separate facets?
- ribbon
logical; show the quantile-based uncertainty interval? Uses
ggplot2::geom_ribbon()for plot.- ncol
numeric; if faceting the plot, how many columns to use. Default arguments will result in three columns.
- ribbon.alpha
numeric; alpha transparency used for the uncertainty interval. Passed to the
alphaaesthetic ofggplot2::geom_ribbon().- xlab
character; label for the x axis.
- ylab
character; label for the y axis.
- title
character; title for the plot.
- subtitle
character; subtitle for the plot.
- caption
character; caption for the plot.
- ...
additional arguments passed to
fortify.poolaccum().