Function adds “labels” or text in a box with non-transparent
background using ggplot2::geom_label() to an ordiggplot()
graph. These can help in congested plot since uppermost labels are
readable (but cover lower ones), or to emphasize text. Some
ggvegan functions call ggplot2::geom_label() with argument
box = TRUE.
Arguments
- score
Ordination score to be added to the plot.
- data
Alternative data to the function that will be used instead of
score. This can be avegan::envfit()result object which is used to plot centroids of factor levels.- ...
other arguments passed to
ggplot2::geom_label()
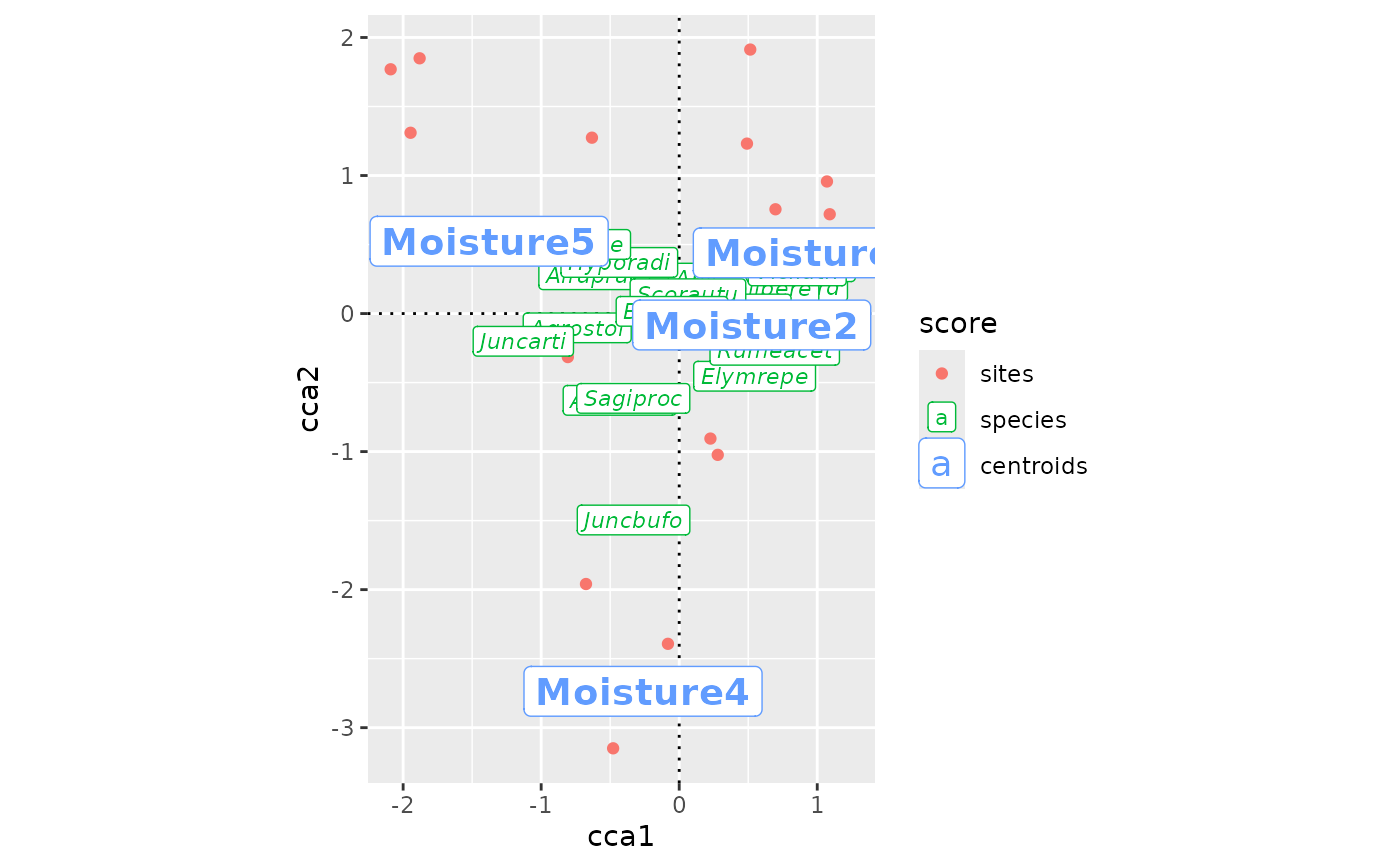
Examples
library(vegan)
library(ggplot2)
data(dune, dune.env, package = "vegan")
mod <- cca(dune ~ Moisture, dune.env)
ordiggplot(mod) +
  geom_ordi_axis() +
  geom_ordi_point("sites") +
  geom_ordi_label("species", size = 3,
    mapping = aes(fontface = "italic")) +
  geom_ordi_label("centroids", size = 5,
    mapping = aes(fontface = "bold"))