Prepares a fortified version of results from
vegan::renyiaccum() objects.
Arguments
- model, x
an object of class
vegan::renyiaccum().- data
original data set. Currently ignored.
- ...
additional arguments passed to other methods. Ignored in this method.
Value
A data frame (tibble) is returned. What is returned depends on how
vegan::renyiaccum() was called.
If raw = FALSE, then a data frame with columns site, scale, mean,
std_dev, min, max, q2.5, and q97.5, containing the accumulated
sites, the Rényi scale, and summary statistics of the
Rényi accumulation curves. An additional column collector
will be present if collector = TRUE was used in the vegan::renyiaccum()
call.
If raw = TRUE, then a data frame with columns site, permutation,
scale, and diversity, containing the site and permutation
identifiers, Rényi scale, and the Rényi
diversity, respectively.
Examples
library("vegan")
library("ggplot2")
data(BCI)
pool <- renyiaccum(BCI)
df <- fortify(pool)
df
#> # A tibble: 300 × 8
#> site scale mean std_dev min max q2.5 q97.5
#> <int> <chr> <dbl> <dbl> <dbl> <dbl> <dbl> <dbl>
#> 1 1 0 4.50 0.0767 4.34 4.69 4.36 4.67
#> 2 2 0 4.80 0.0641 4.63 4.92 4.65 4.91
#> 3 3 0 4.93 0.0484 4.75 5.02 4.83 5.01
#> 4 4 0 5.01 0.0387 4.90 5.09 4.93 5.08
#> 5 5 0 5.07 0.0348 4.98 5.14 4.99 5.12
#> 6 6 0 5.11 0.0324 5.02 5.18 5.04 5.16
#> 7 7 0 5.14 0.0287 5.06 5.20 5.08 5.19
#> 8 8 0 5.17 0.0279 5.09 5.24 5.11 5.21
#> 9 9 0 5.19 0.0269 5.11 5.26 5.13 5.23
#> 10 10 0 5.21 0.0258 5.14 5.28 5.15 5.25
#> # ℹ 290 more rows
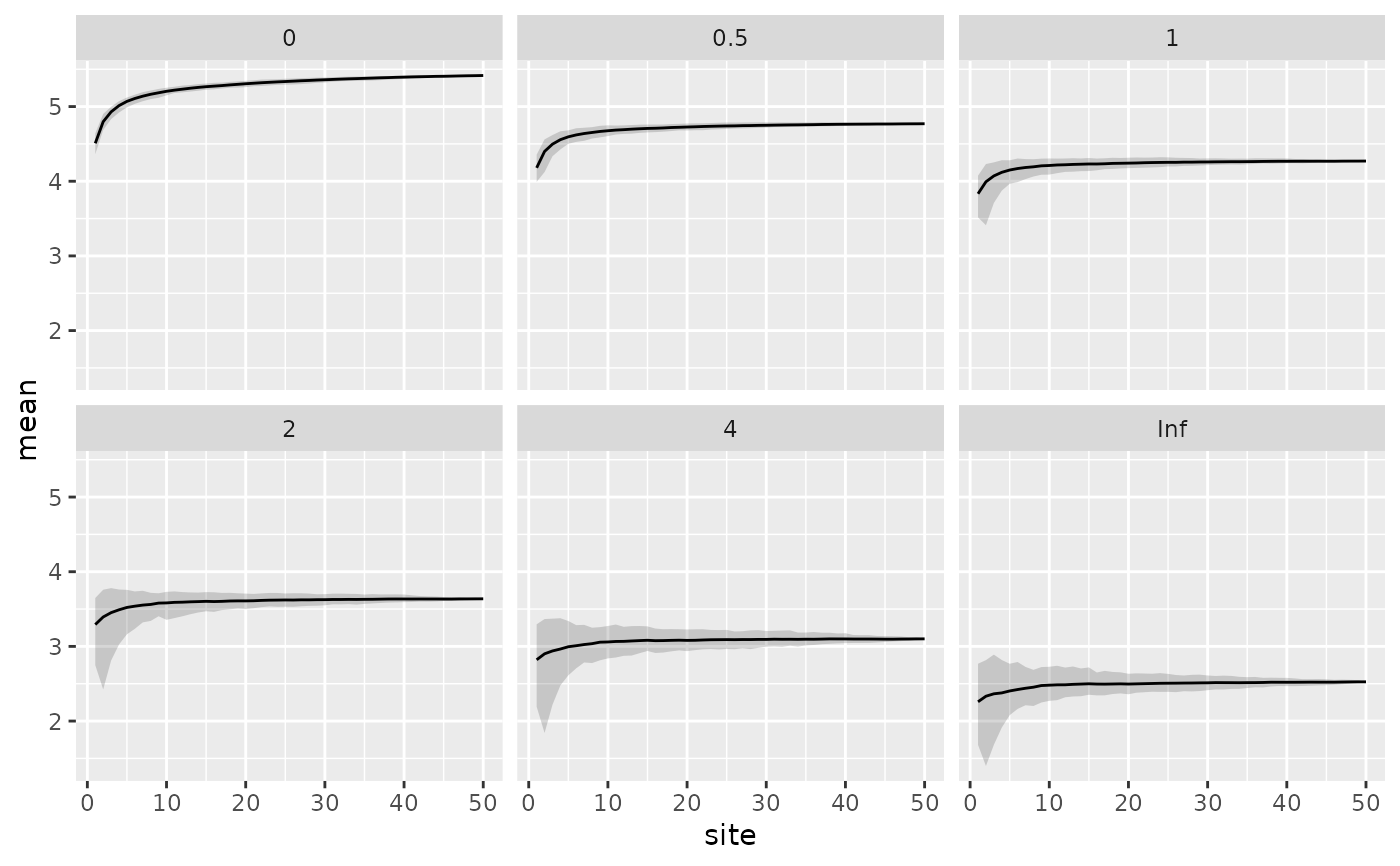
ggplot(df, aes(x = site, y = mean)) +
geom_ribbon(aes(ymin = q2.5, ymax = q97.5, x = site),
alpha = 0.2, inherit.aes = FALSE) +
geom_line() +
facet_wrap(~ scale)