Fortify isometric feature mapping results
fortify.isomap.RdPrepares fortified versions of results from isomap objects.
Arguments
- model
an object of class
isomap.- data
data.frame; additonal data to be added to the forified object.
- axes
numeric; which axes to return. For
what = "network"this must be of length two only.- what
character; what aspect of the results should be fortified?
"sites"returns to ordination scores from the multidimensional scaling part of the model."network"returns the coordinates for edges joining points.- ...
additional arguments for other methods. Currently ignored.
Value
A data frame. For what = "sites", the data frame contains one variable per dimension of the multidimensional scaling embedding of the dissimilarities. Variables are named "DimX" with "X" being an integer. An adidtional variable is label, containing a label for each observation. For what = "network", the data frame contains four variables cotaining the coordinates in the chosen MDS axes for the start and end points of the network edges.
Details
Two different objects can be created from the results of an isomap object. The first is the standard scores representation of fortified ordinations in vegan, which results in a wide data frame where rows cotain observations and columne the coordinates of observations on the MDS axes. Because ISOMAP also produces a network or sorts, the coordinates of the edges of the network can also be returned in a tidy format using what = "network".
Examples
library("ggplot2")
data(BCI)
dis <- vegdist(BCI)
ord <- isomap(dis, k = 3)

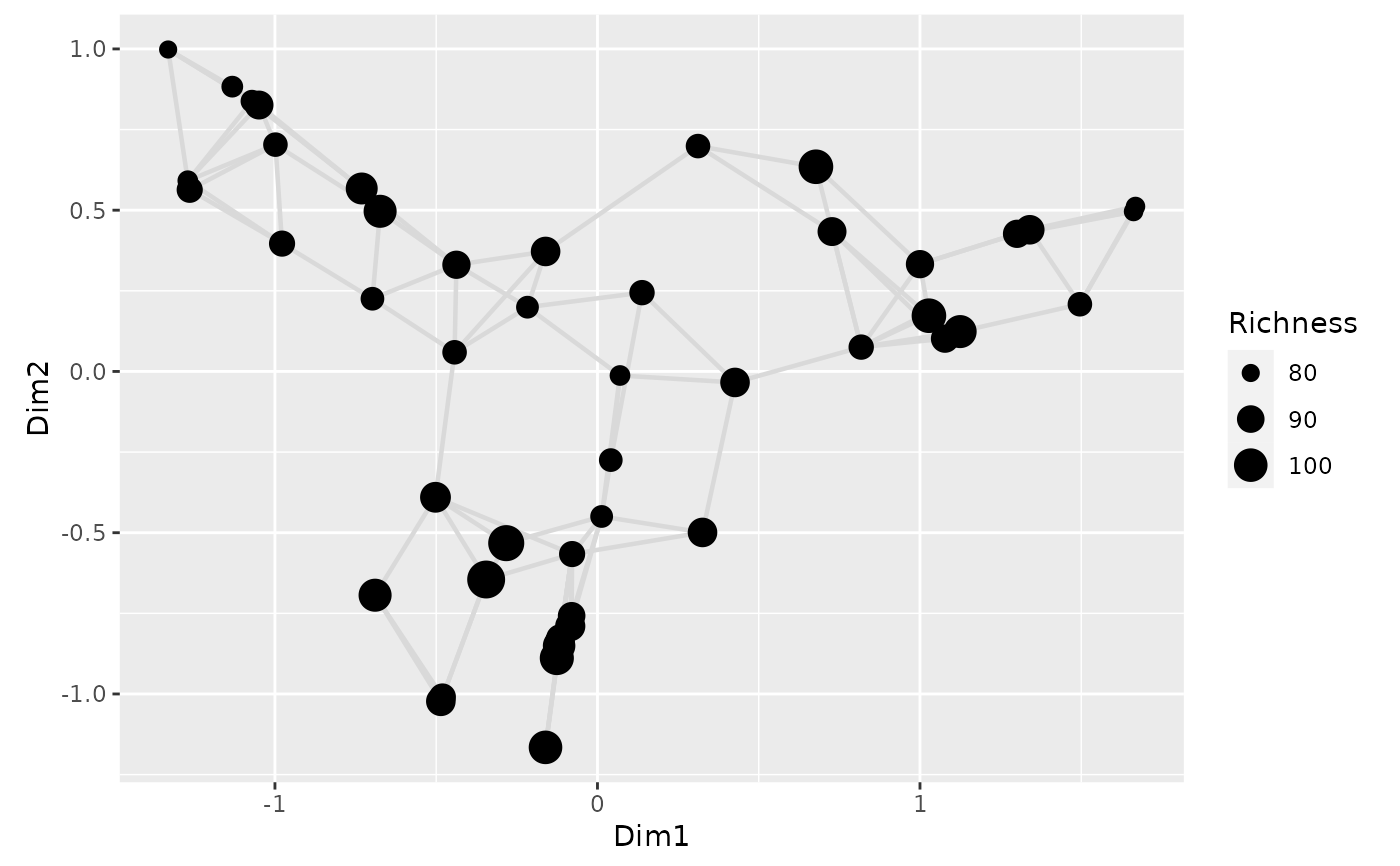
df <- fortify(ord, data = data.frame(Richness = specnumber(BCI)))
net <- fortify(ord, what = "network", axes = 1:2)

ggplot(df, aes(x = Dim1, y = Dim2)) +
    geom_segment(data = net,
                 aes(x = xfrom, y = yfrom,
                     xend = xto, yend = yto),
                 colour = "grey85", size = 0.8) +
    geom_point(aes(size = Richness)) +
    coord_fixed()
#> Warning: Using `size` aesthetic for lines was deprecated in ggplot2 3.4.0.
#> ℹ Please use `linewidth` instead.
