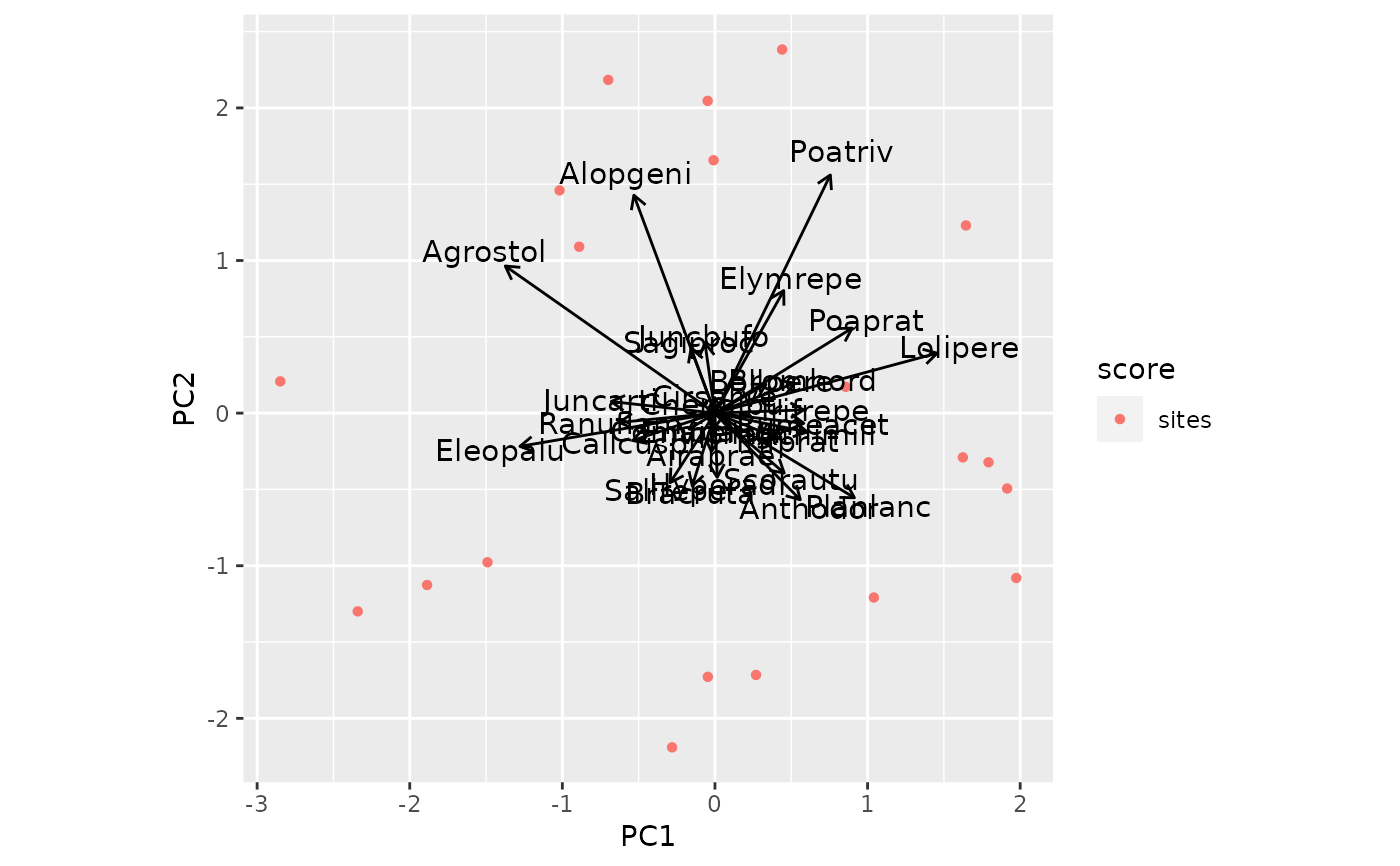
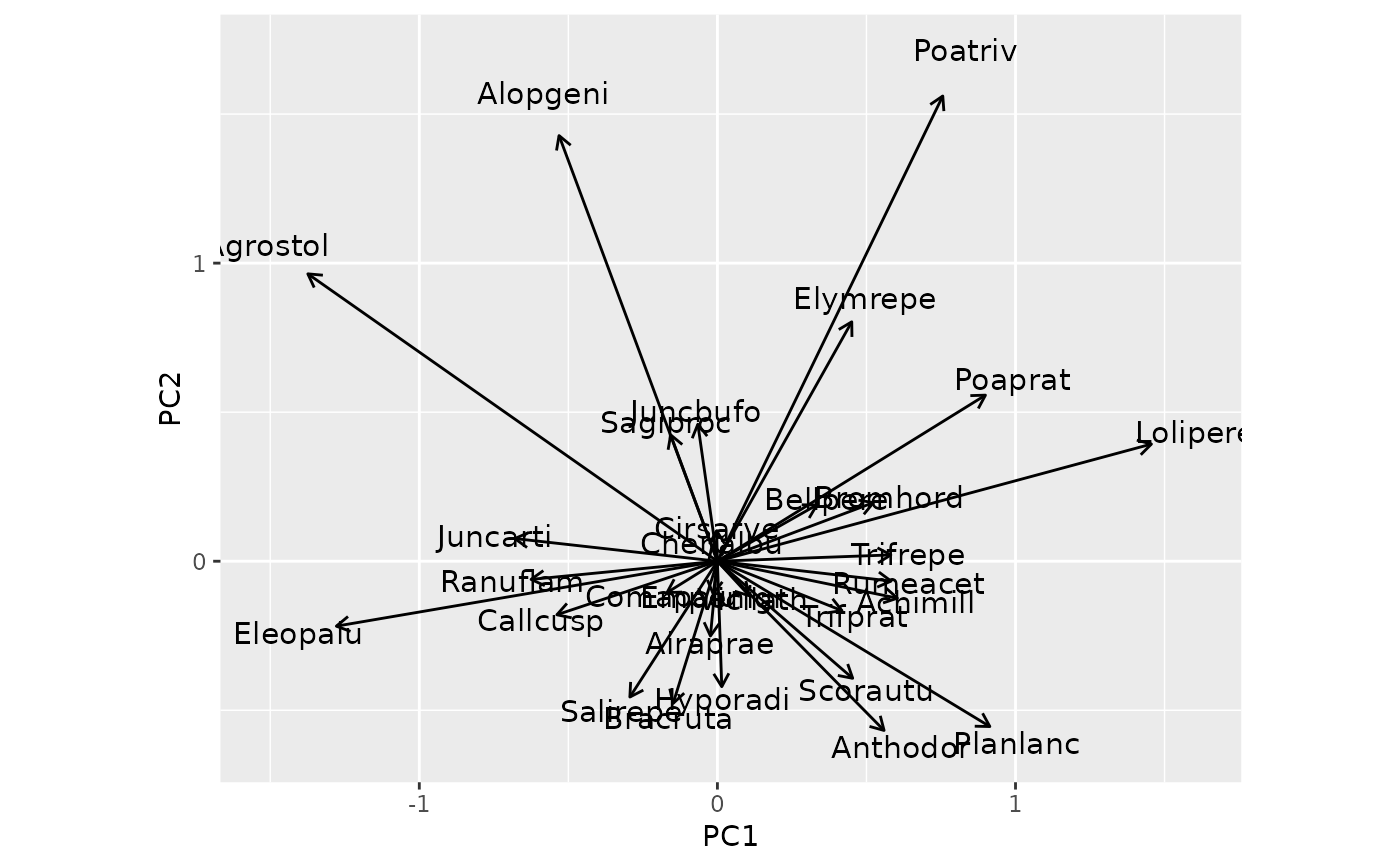
Produces a multi-layer ggplot object representing the output of objects
produced by vegan::rda().
Arguments
- object
an object of class
"rda", the result of a call tovegan::rda()- axes
numeric; which axes to plot, given as a vector of length 2.
- geom
character; which geom to use for the species (variables) and sites (samples) layers. A vector of length 2; if a vector of length 1,
geomis extended to the required length.- layers
character; which scores to plot as layers
- arrows
logical; represent species (variables) using vectors?
- legend.position
character or two-element numeric vector; where to position the legend. See
ggplot2::theme()for details. Use"none"to not draw the legend.- title
character; subtitle for the plot.
- subtitle
character; subtitle for the plot.
- caption
character; caption for the plot.
- ylab
character; label for the y-axis.
- xlab
character; label for the x-axis.
- const
General scaling constant to
rdascores. Seevegan::scores.rda()for details.- arrow.col
colour specification for biplot arrows and their labels.
- ...
Additional arguments passed to the
fortify()method.