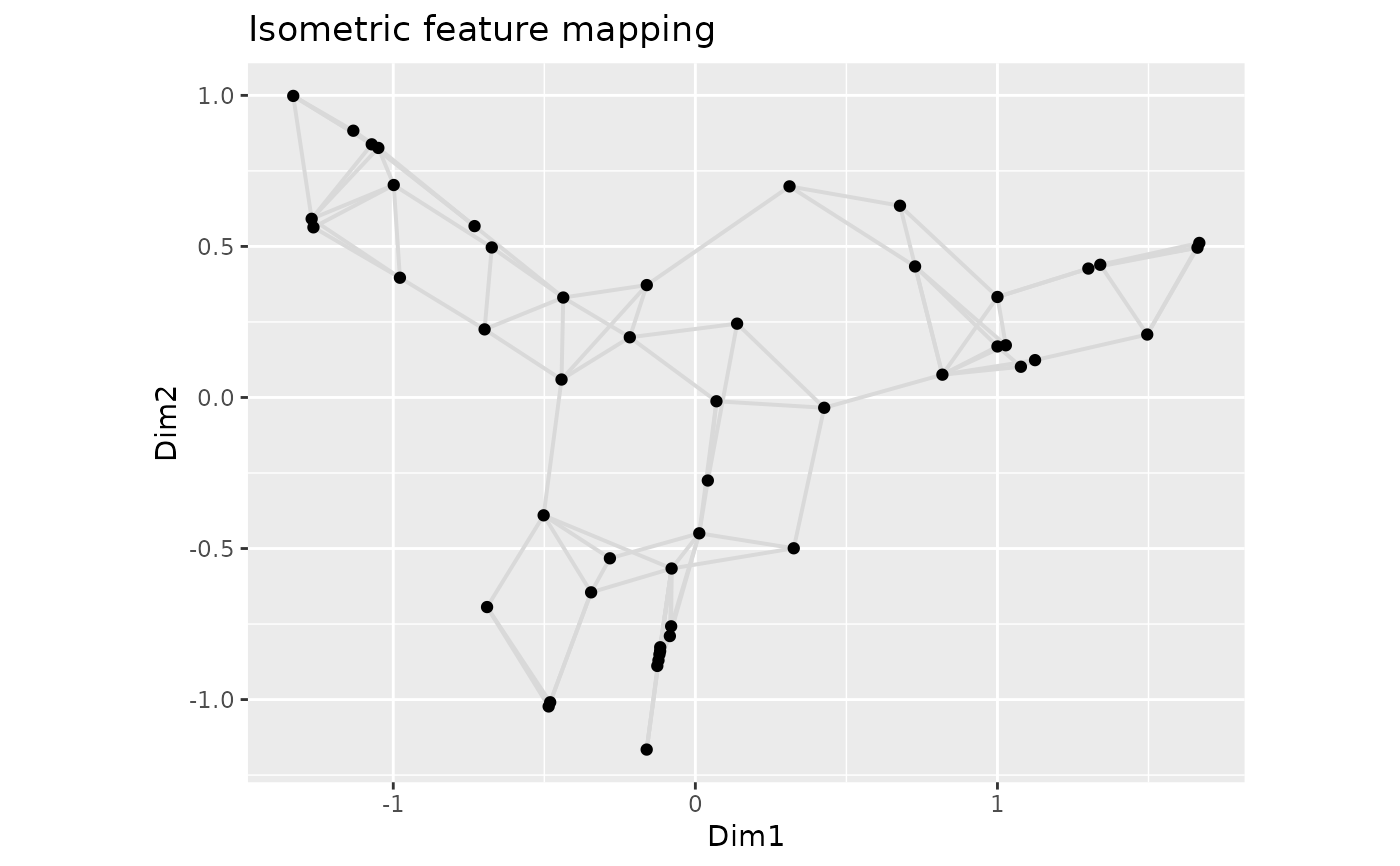
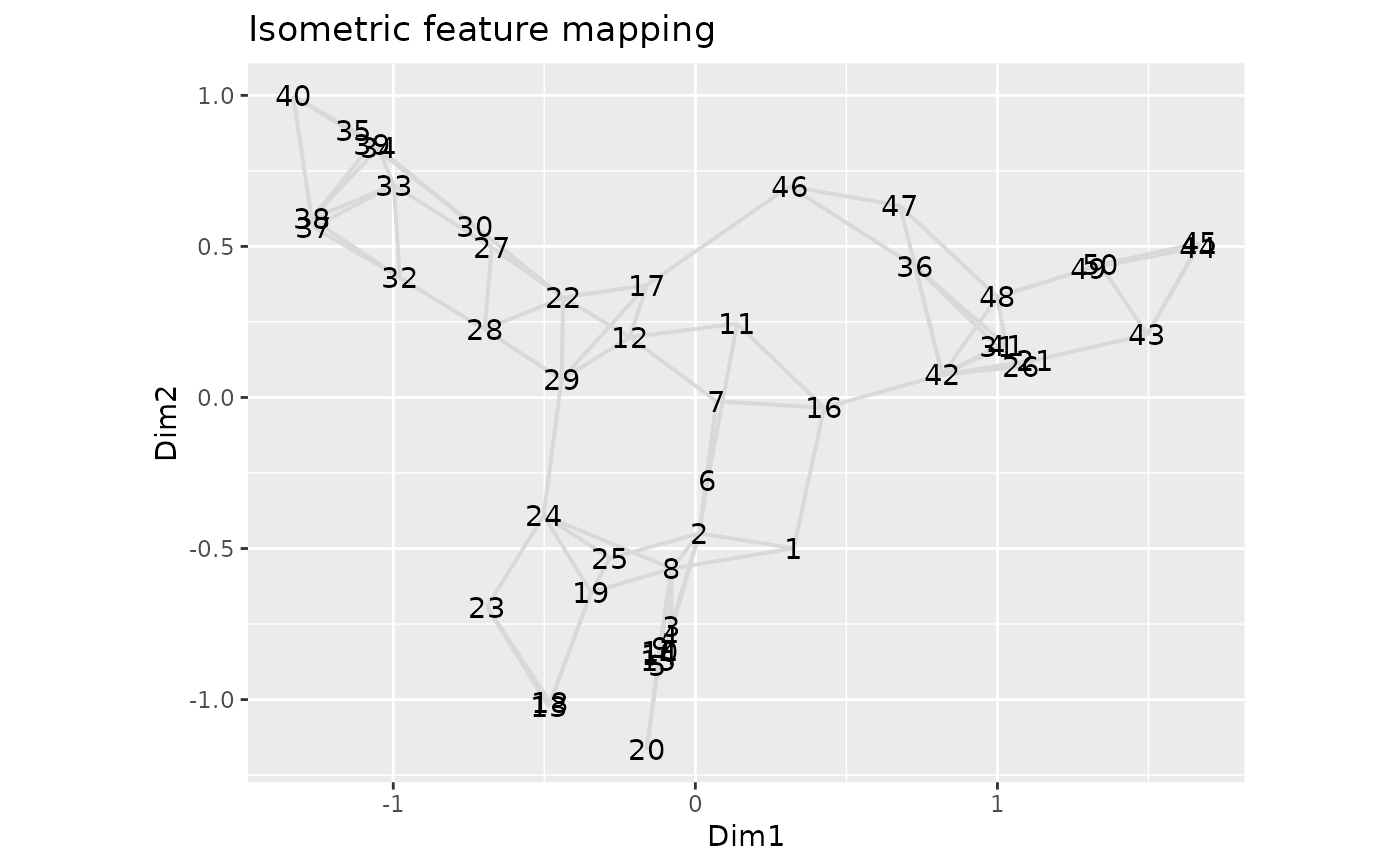
ggplot-based plot for objects of class "isomap"
autoplot.isomap.RdProduces a multi-layer ggplot object representing the output of objects produced by isomap.
Arguments
- object
an object of class
"isomap", the result of a call toisomap.- axes
numeric; which axes to plot, given as a vector of length 2.
- geom
character; which geom to use for the MDS scores layer.
- network
logical; should the edges of the ISOMAP network be drawn?
- line.col
colour with which to draw the network edges.
- size
numeric; size aesthetic for the log-series curve.
- xlab
character; label for the x-axis.
- ylab
character; label for the y-axis.
- title
character; subtitle for the plot.
- subtitle
character; subtitle for the plot.
- caption
character; caption for the plot.
- ...
additional arguments passed to other methods.
Value
A ggplot object.

