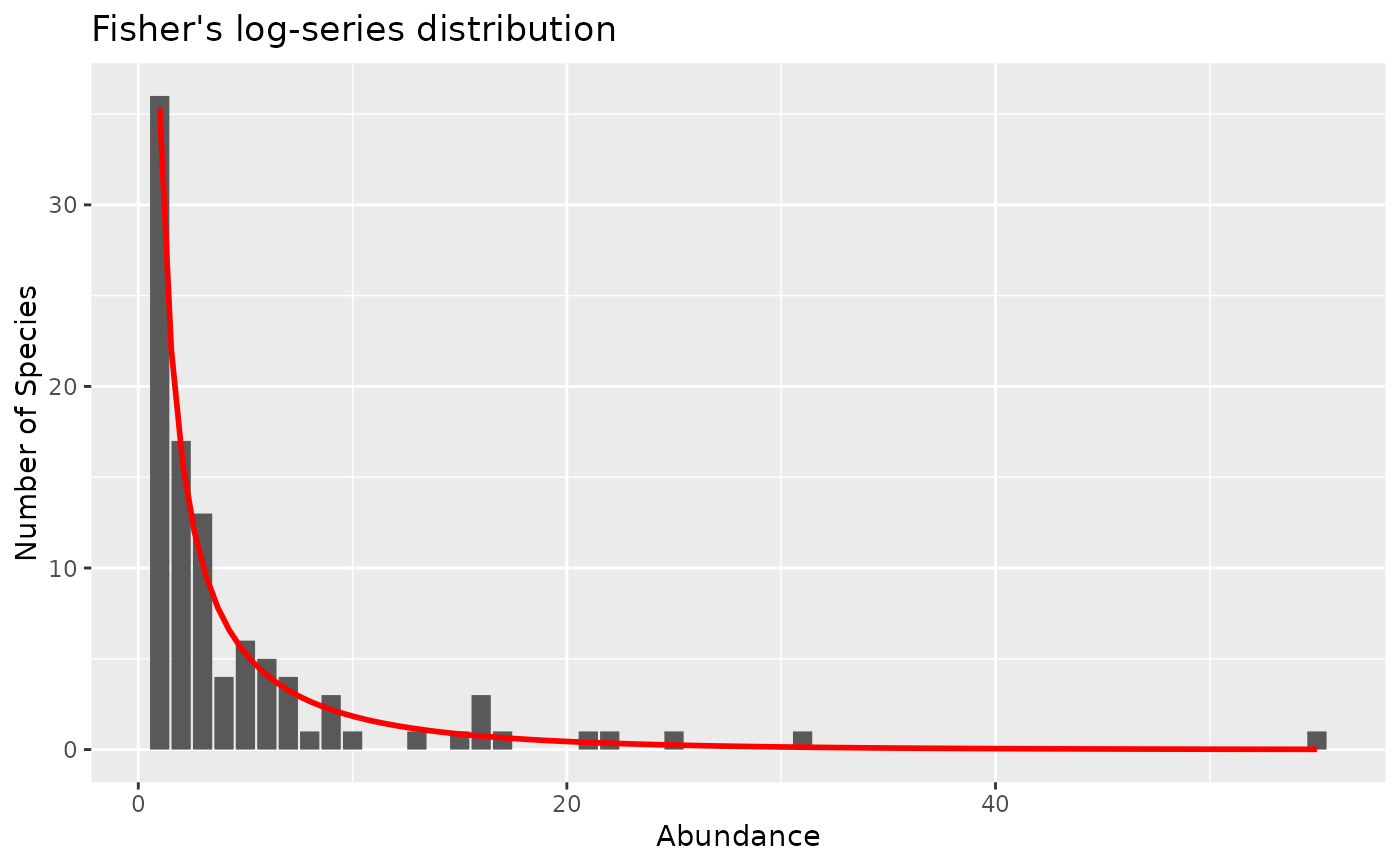
Draws a bar plot of species rank abundance with Fisher's log-series superimposed.
Usage
# S3 method for class 'fisherfit'
autoplot(
  object,
  show.fitted = TRUE,
  xlab = "Abundance",
  ylab = "Number of Species",
  title = "Fisher's log-series distribution",
  bar.col = NA,
  bar.fill = "grey35",
  line.col = "red",
  linewidth = 0.7,
  subtitle = NULL,
  caption = NULL,
  ...
)
Arguments
- object
an object of class
vegan::fisherfit().- show.fitted
logical; should the estimated distribution also be plotted?
- xlab
character; label for the x axis.
- ylab
character; label for the y axis.
- title
character; subtitle for the plot.
- bar.col
colour for the bar outlines. The default,
NA, does not draw outlines around bars.- bar.fill
fill colour for the bars.
- line.col
colour for Fisher's log-series curve.
- linewidth
numeric; linewidth aesthetic for the log-series curve.
- subtitle
character; subtitle for the plot.
- caption
character; caption for the plot.
- ...
additional arguments passed to other methods.