Produces a multi-layer ggplot object representing the output of objects
produced by vegan::envfit().
Arguments
- object
an object of class
"envfit", the result of a call tovegan::envfit().- geom
character; which geom to use to label vectors and factor centroids.
- line.col
colour with which to draw vectors.
- xlab
character; label for the x-axis.
- ylab
character; label for the y-axis.
- title
character; subtitle for the plot.
- subtitle
character; subtitle for the plot.
- caption
character; caption for the plot.
- ...
additional arguments passed to
ggplot2::fortify().
Examples
library("vegan")
data(varespec, varechem)
ord1 <- metaMDS(varespec)
#> Square root transformation
#> Wisconsin double standardization
#> Run 0 stress 0.1843196
#> Run 1 stress 0.2088293
#> Run 2 stress 0.1948413
#> Run 3 stress 0.2080747
#> Run 4 stress 0.195049
#> Run 5 stress 0.2124727
#> Run 6 stress 0.1843196
#> ... New best solution
#> ... Procrustes: rmse 1.827695e-05 max resid 6.433439e-05
#> ... Similar to previous best
#> Run 7 stress 0.2133812
#> Run 8 stress 0.1948414
#> Run 9 stress 0.2085514
#> Run 10 stress 0.2345867
#> Run 11 stress 0.1843196
#> ... New best solution
#> ... Procrustes: rmse 1.214334e-05 max resid 4.03412e-05
#> ... Similar to previous best
#> Run 12 stress 0.195049
#> Run 13 stress 0.2143611
#> Run 14 stress 0.2088293
#> Run 15 stress 0.1955837
#> Run 16 stress 0.2028828
#> Run 17 stress 0.2085949
#> Run 18 stress 0.2166093
#> Run 19 stress 0.1982376
#> Run 20 stress 0.1948413
#> *** Best solution repeated 1 times
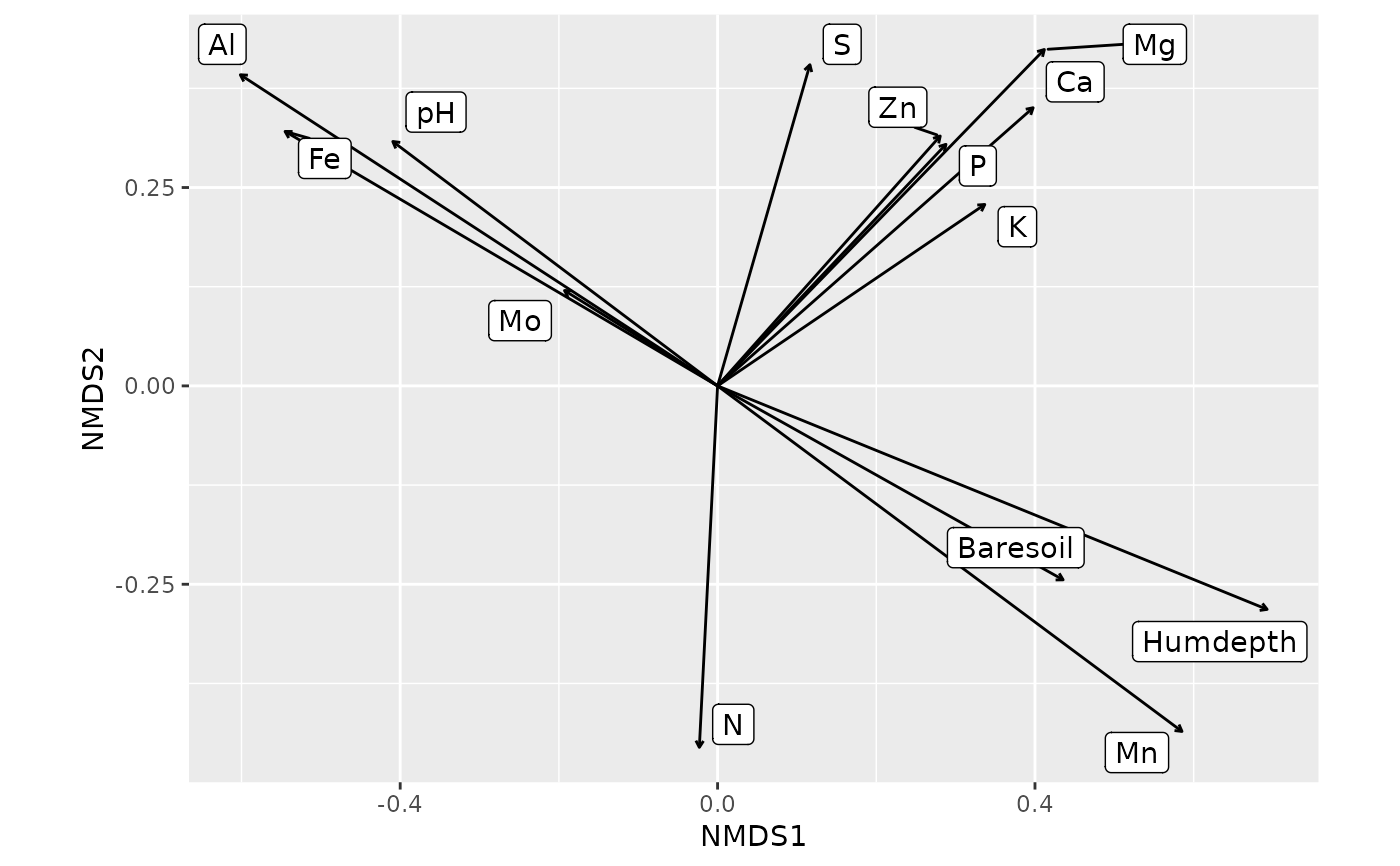
fit1 <- envfit(ord1, varechem, perm = 199)
autoplot(fit1, geom = 'label_repel')
 data(dune, dune.env)
ord2 <- cca(dune)
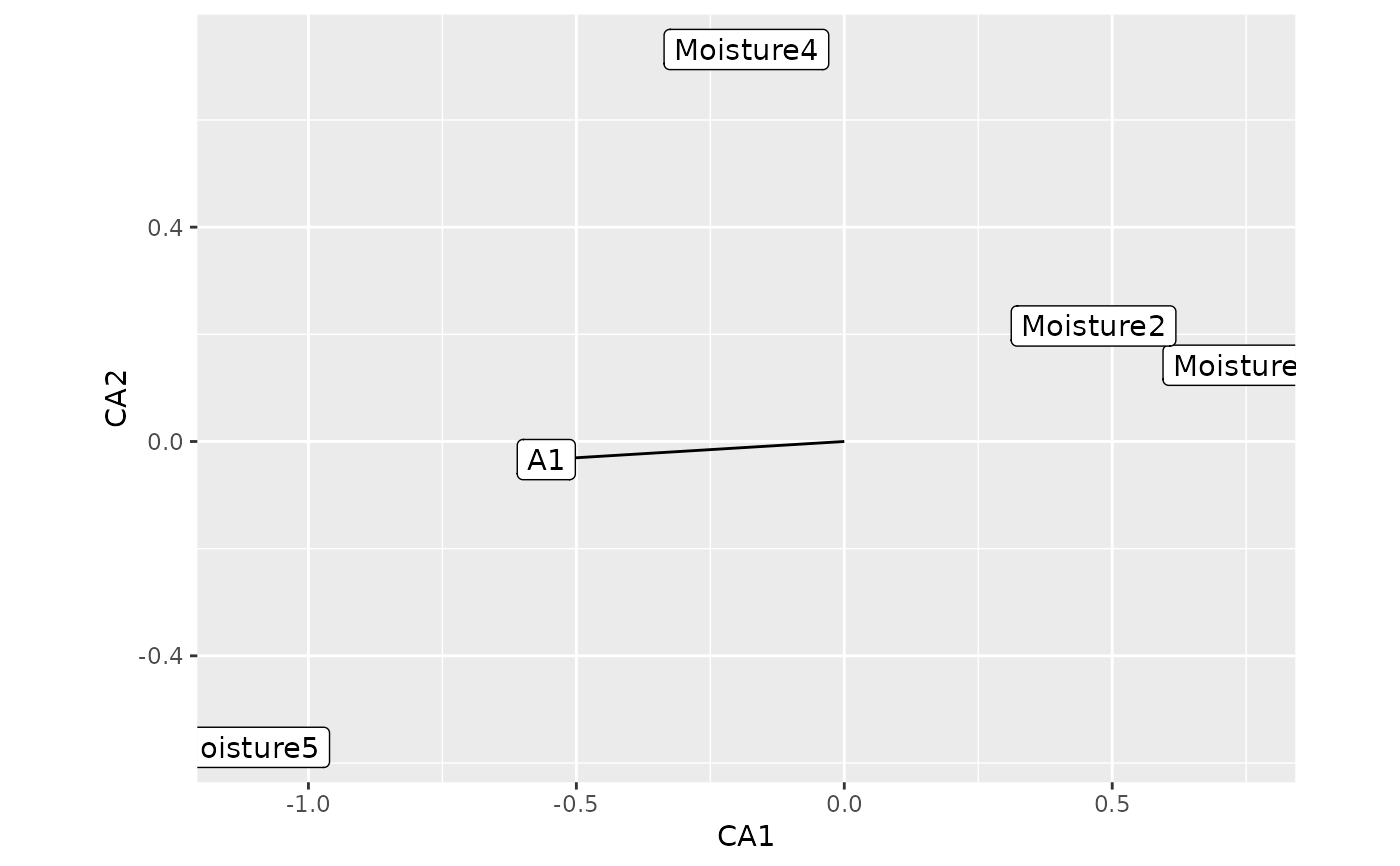
fit2 <- envfit(ord2 ~ Moisture + A1, dune.env, perm = 199)
autoplot(fit2)
data(dune, dune.env)
ord2 <- cca(dune)
fit2 <- envfit(ord2 ~ Moisture + A1, dune.env, perm = 199)
autoplot(fit2)