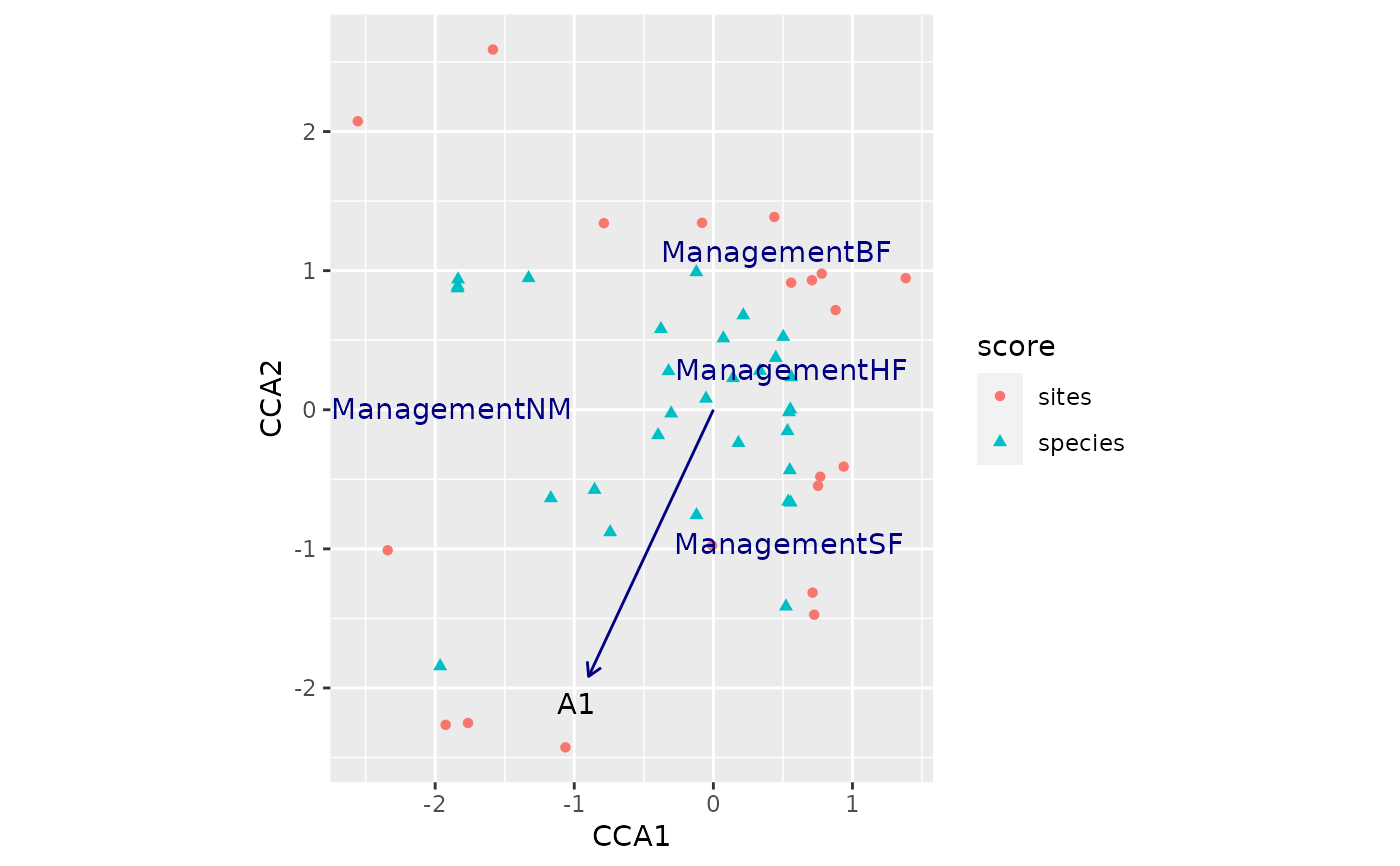
ggplot-based plot for objects of class "cca"
autoplot.cca.RdProduces a multi-layer ggplot object representing the output of objects produced by cca, or capscale.
Arguments
- object
an object of class
"cca", the result of a call toccaorcapscale.- axes
numeric; which axes to plot, given as a vector of length 2.
- geom
character; which geoms to use for the layers. Can be a vector of length equal to
length(display), in which case the ith element oftyperefers to the ith element ofdisplay.- layers
character; which scores to plot as layers
- legend.position
character or two-element numeric vector; where to position the legend. See
themefor details. Use"none"to not draw the legend.- title
character; subtitle for the plot
- subtitle
character; subtitle for the plot
- caption
character; caption for the plot
- ylab
character; label for the y-axis
- xlab
character; label for the x-axis
- ...
Additional arguments passed to
fortify.cca.
Value
Returns a ggplot object.
Details
TODO
