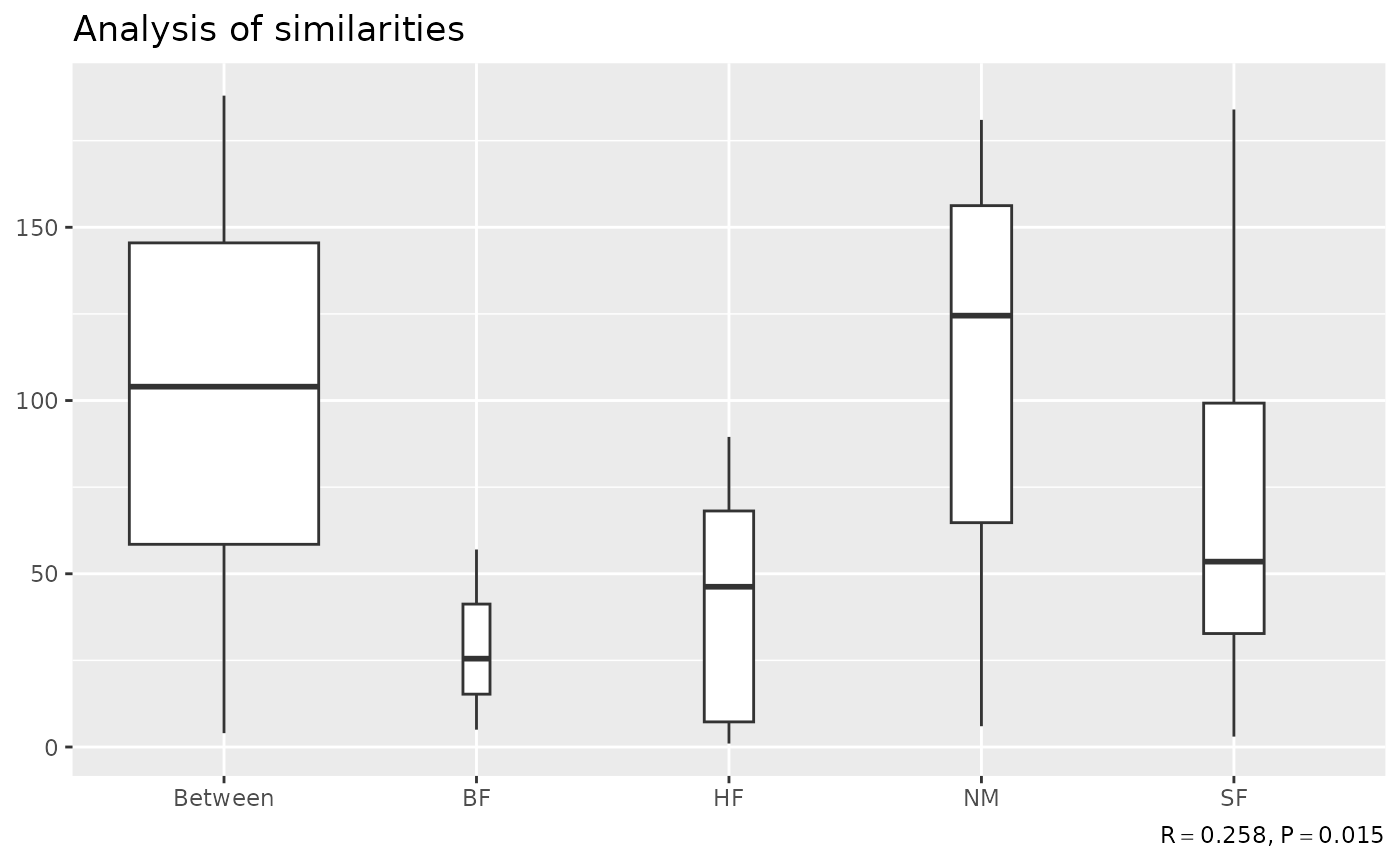
ggplot-based plot for objects of class "anosim"
autoplot.anosim.RdProduces a multi-layer ggplot object representing the output of objects produced by anosim.
Arguments
- object
an object of class
"anosim", the result of a call toanosim.- notch
logical; make notched (default) or standard box plot?
- varwidth
logical; make box width proportional to the square-root of the number of observations in the group (default)?
- xlab
character; label for the x-axis.
- ylab
character; label for the y-axis.
- title
character; title for the plot.
- subtitle
character; subtitle for the plot.
- caption
character; caption for the plot.
- ...
additional arguments passed to other methods.
Value
A ggplot object.
